


Every once in a while I write a piece comparing the salaries of Canadian University Presidents with the salaries of University Presidents in other countries (see here, here and here). These are always some of my least-liked pieces because what I write does not fit with people’s prejudices. Get faculty—or students, or the general public for that matter—started on what ails Canadian universities, and eventually the subject of “crazy Presidential salaries” gets mentioned. Even without looking at the data in detail, everyone should know this is prima facie nonsense: total national institutional expenditures on Presidential salaries in Canada is in the $27-$28 million range, or less than .05% of total expenditures. Would that we could live in a world where our underfunding problems are that small. But if you do choose to look at the data, you can find some pretty interesting things. So, let’s go.
Let’s start just by looking at trends in Presidential Compensation. The Canadian Association of University Teachers (CAUT) stopped fully updating its formerly-useful annual Almanac around the time HESA started publishing The State of Post-Secondary Education (free riders!), but it does continue to update some bits. One file they have kept up dating is the one on Presidential salaries (available here, figure 2.8), which handily shows data both for 2013 and 2020 (note to CAUT: please keep updating this file!). In order to find out how much Presidential pay increased over this period, I took data for all institutions where data was available for total Presidential compensation (ie salaries and benefits) in both years, which meant excluding 9 universities. I then adjusted the 2013 figure for inflation to make it comparable to the 2020 survey.
Figure 1 shows the distribution of changes from 2013 to 2020. There are some big outliers at both extremes, but in most cases it’s because either 2013 or 2020 was a year in which an institution switched Presidents, and since CAUT only collects data on the President in office on Dec. 31, that means either the base or the comparison year is about half what it should be if we had full-year, meaning these outliers kind of cancel each other out. Check more closely, and you will see that half of all 2020 university Presidents actually made less than their 2013 counterparts in real terms (my guess is that this figure would increase substantially if we had data for 2023). Nationally, in inflation-adjusted dollars, the average Presidential salaries increased from $327,020…to $327,423. Or 0.12%. Or about 0.017% annually.
Figure 1: Distribution of Changes in Canadian University Presidential Salaries, 2013-2020
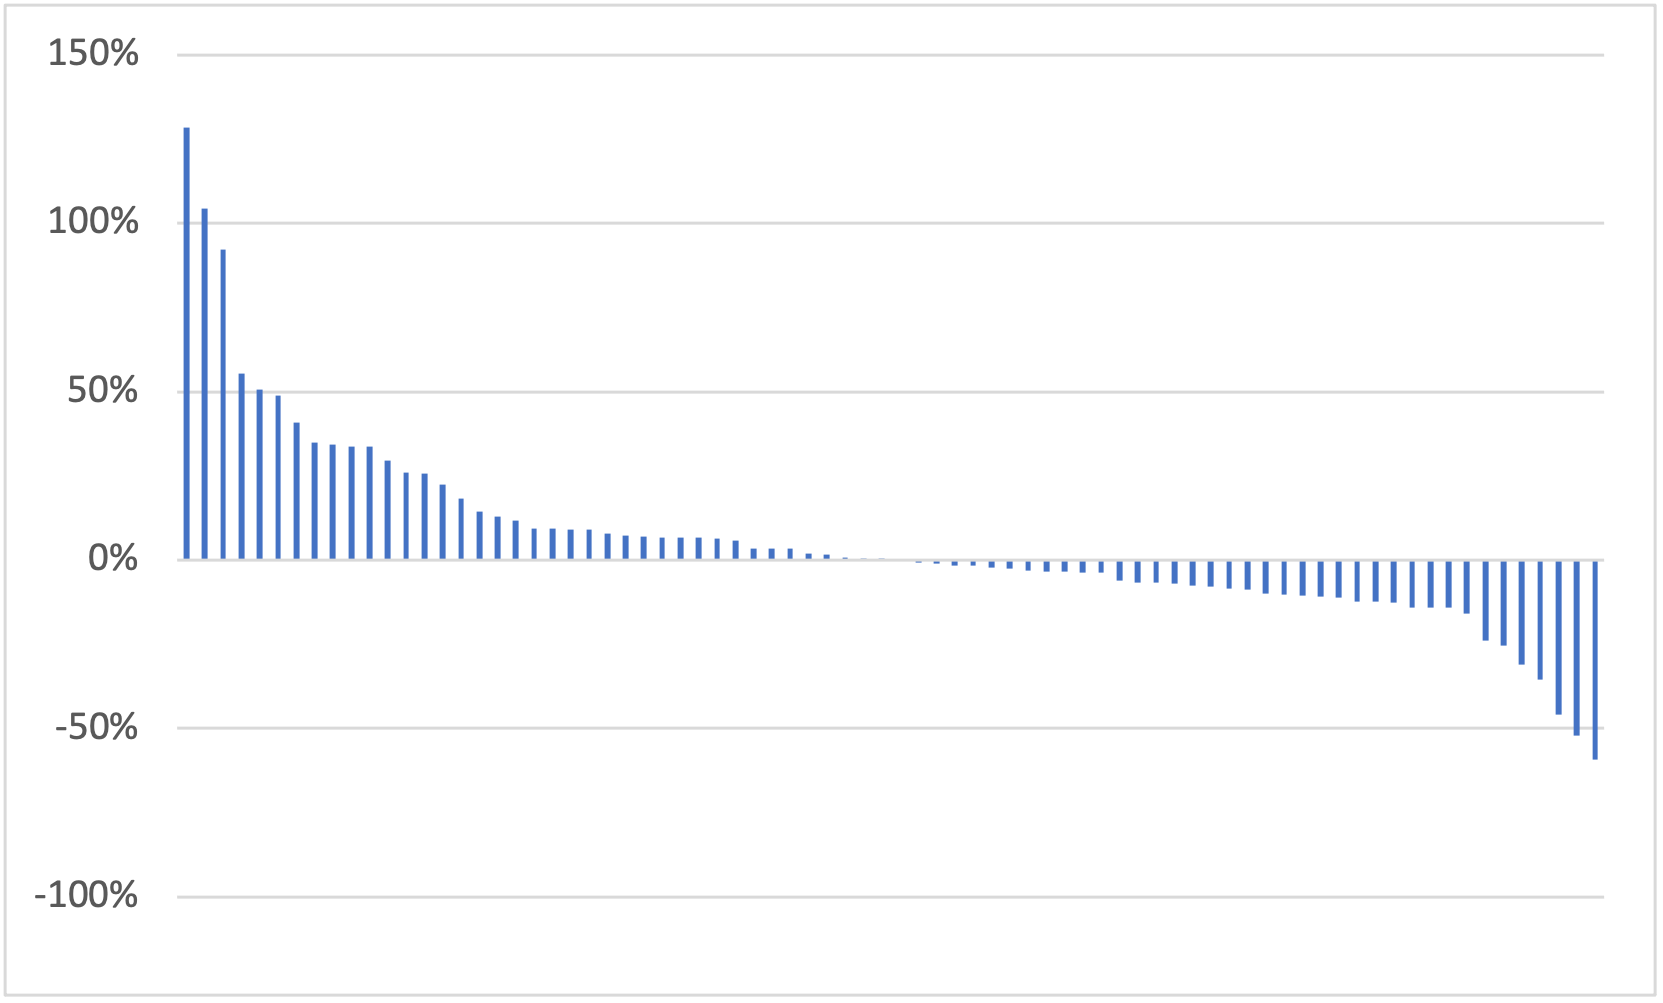
Why is this happening? Well it’s pretty similar to what happens with faculty salaries. When someone is in the Presidency for awhile, their salary drifts upwards. But then, when they leave and a new President is appointed, the base salary drops a bit towards where the previous President’s was at the start of their term. Therefore you always have something of a balance with some going up and some down.
Now we have established that Presidential salaries aren’t skyrocketing, how about comparing Canadian universities just to other countries in the anglosphere? This is a little tricky because different countries contain different kinds of universities. Australia, for instance, is essentially bereft of small universities, while New Zealand really only has one institution that looks like one of our U15s. So some of the comparisons I am going to make here are going to be a little bit bespoke. Tant pis: you’re just going to have to live with my best judgement.
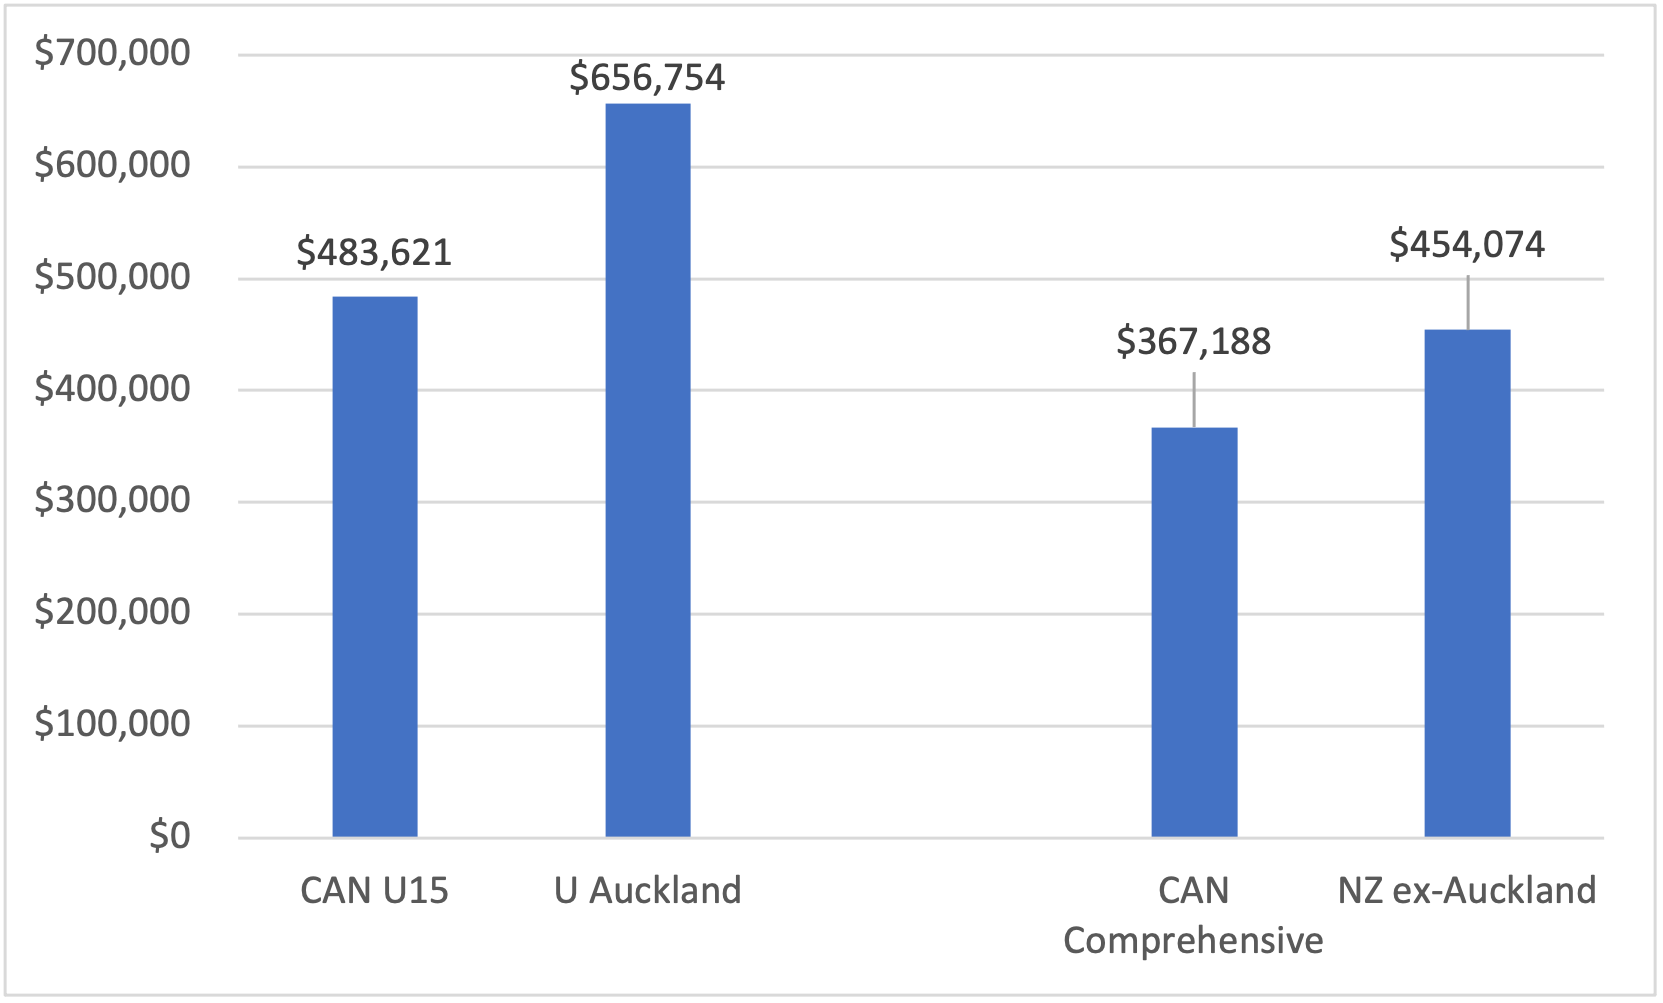
Figure 2 compares Canadian Presidential salaries to those in New Zealand. Here I compare average U15 salaries (minus Alberta because the 2020 data is only partial for that year) to the University of Auckland and average salaries at what Maclean’s calls the “comprehensive universities” (minus Waterloo which is in the U15 category), plus UQTR and Sherbrooke to NZ’s other seven universities. Comparisons are for the 2020 year and NZ salaries have been converted to Canadian dollars at a PPP of $1 NZ = $0.8699 CAD, as per OECD. What we get is shown below in Figure 2.
Figure 2: Canadian Presidential Salaries vs. New Zealand, in Canadian dollars
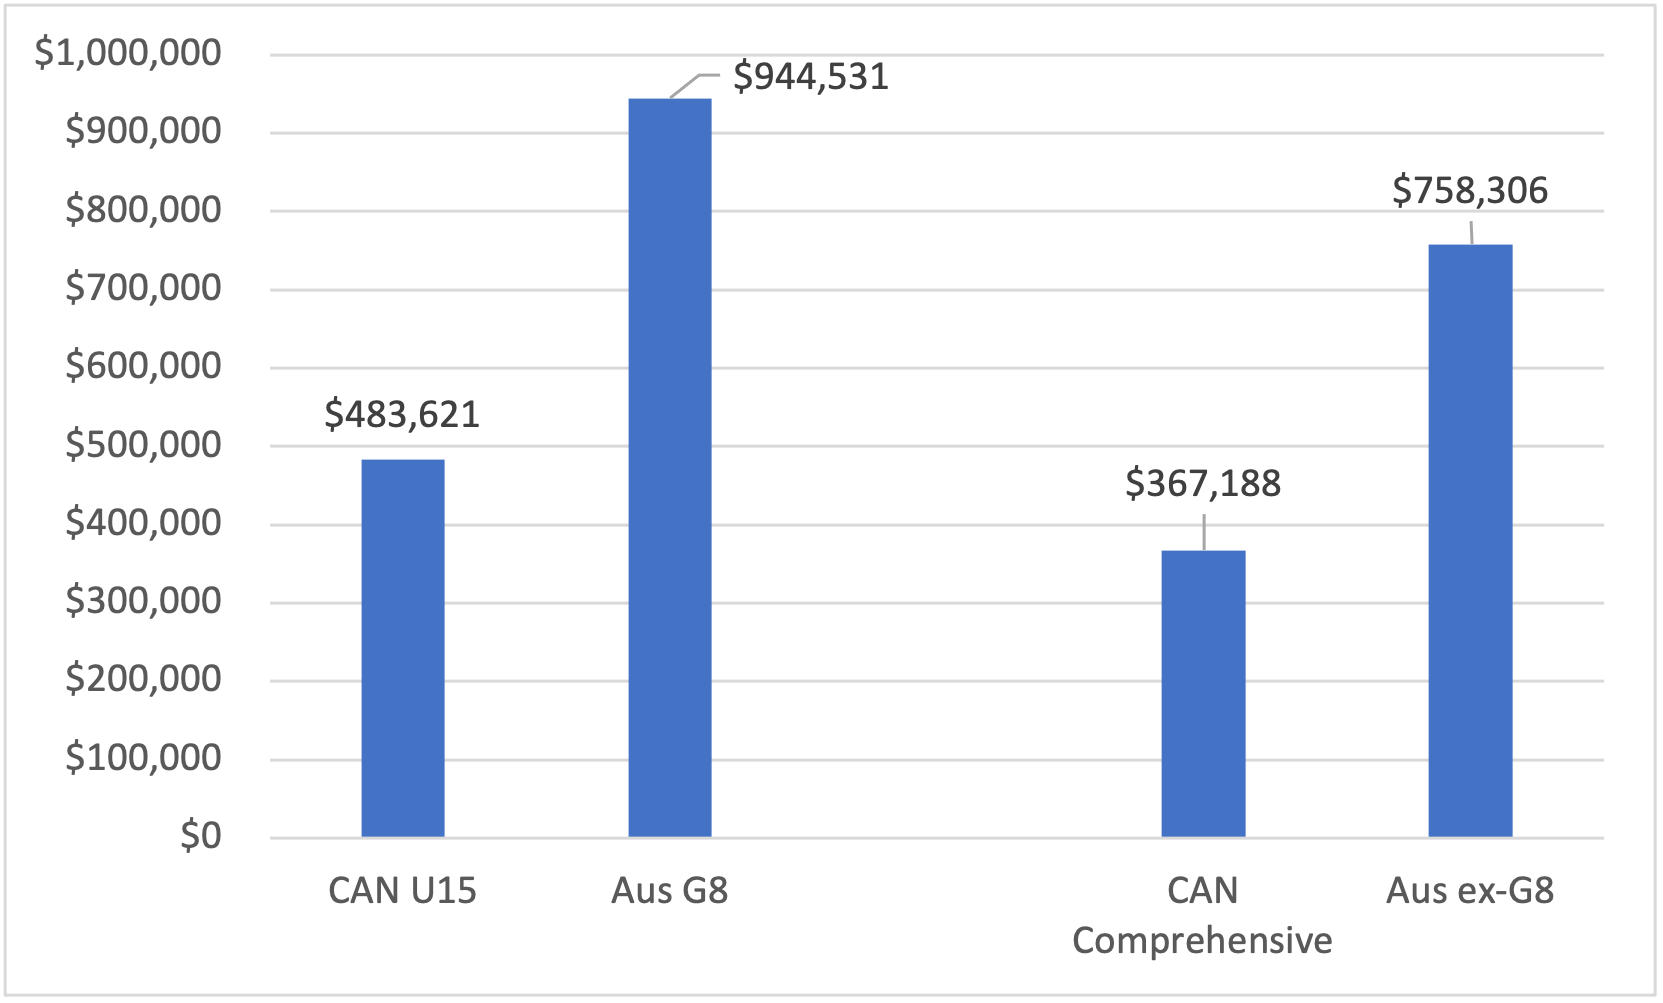
Now let’s compare Canada to Australia, because that’s always fun. Australia has a “G-8” group which is functionally equivalent if perhaps a bit more elite to our U15, so that comparison is obvious. I have chosen to compare the rest of Australia to our comprehensive universities simply because there aren’t a lot of small universities in the country. Data for Australia is for 2021, so not quite apples-to-apples (sorry). Australian dollars are translated to Canadian ones at PPP at a rate of $1AUD = $08459 CAD. Figure 3 shows the comparisons.
Figure 3: Canadian Presidential Salaries vs. Australia, in Canadian dollars
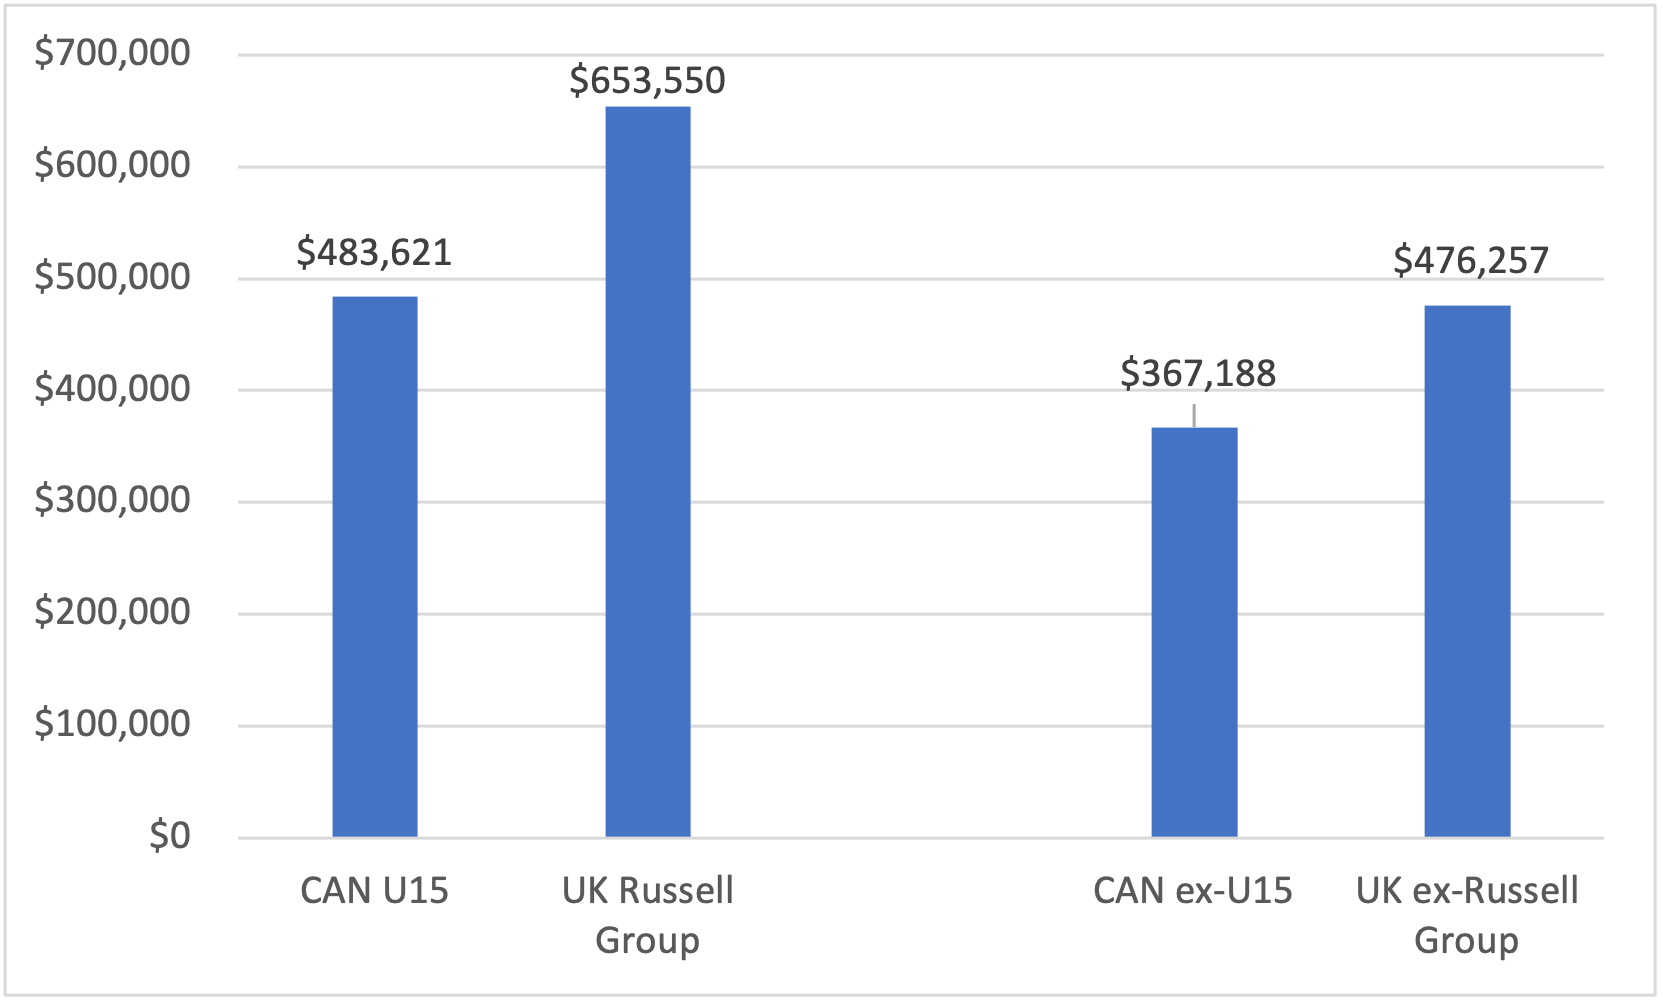
Now the UK. Again, there is a group of elite universities—the “Russell Group” of universities, for some reason named after the hotel in which they first met—which like the G-8 are functionally equivalent to our U15 even if on average they are a bit more research intensive. Like Canada, UK has a mix of big and small universities outside the Russell Group, so a comparison between the entirety of the public sector outside the Russell Group/U15 seem appropriate here. Figure 4 shows the comparison. UK data is for 2020-21 and is converted to Canadian dollars at a PPP of $1 GBP = $1.793 CAD.
Figure 4: Canadian Presidential Salaries vs. the United Kingdom in Canadian dollars
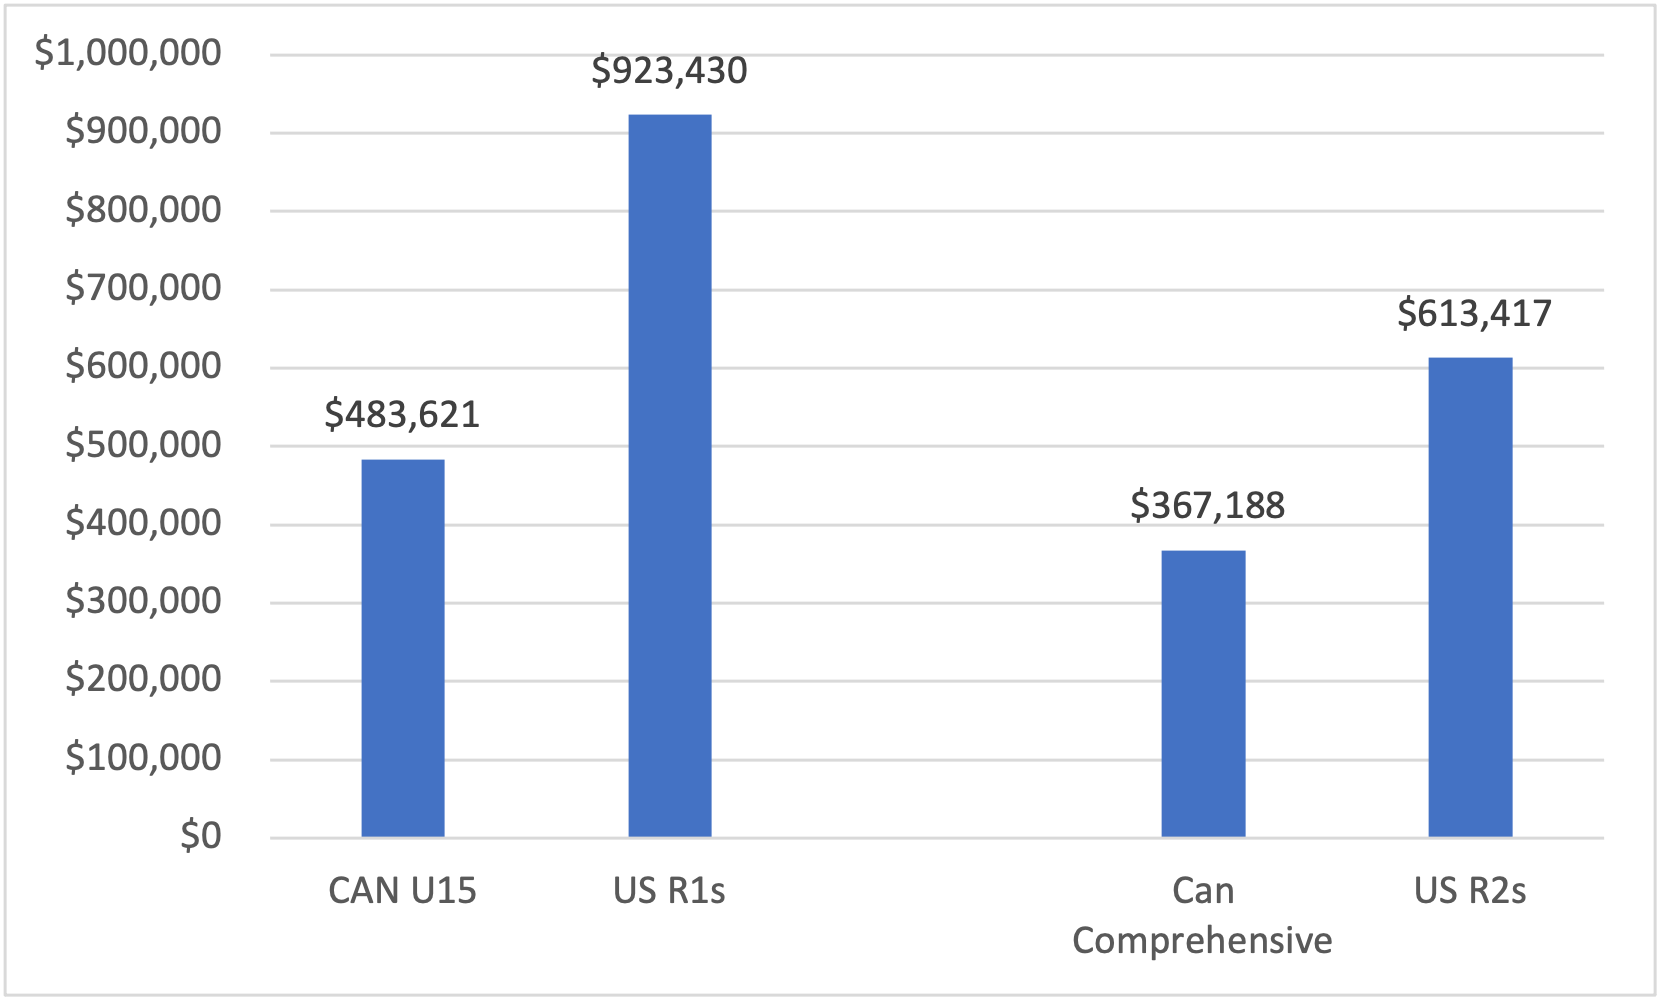
And finally, the United States. Finding good comparisons here is really tricky because the system is so vast and differentiated. In the end, using the Carnegie classifications, I went with using all public R1 universities as a comparator for the U15, and all non-R1 public doctoral universities as the comparator for Canada’s “comprehensive” group. One could easily quibble with this choice—it’s probably a better comparison for the R1s than the R2s—but it’s what I’m going to go with. Data comes from the Chronicle of Higher Education’s annual Presidential Compensation survey for 2022, which unfortunately is missing some data because of institutional non-response. For the big absence of University of California data, I have supplemented the Chronicle data with data from the UC system office. I have restricted data to only cover campus CEOs; system-level directors (the highest paid of which earns $2.5M US) are excluded from the sample. Where multiple individuals from a single institution appear (i.e., when more than one individual served as President at an institution for a year), I have only taken the one with the highest pay. Figure 4 shows the comparison. US dollars are converted to Canadian dollars at PPP at a rate of $1 USD = $1.165 CAD.
Figure 5: Canadian Presidential Salaries vs. the United States in Canadian dollars
Now we can put all of these together. For Figure 6, the left-hand cluster in blue represents the universities with the highest research intensity for the five countries, while the right-hand cluster in red is a bit of a mixed bag (“R2” for the US is a more restricted sample than Canadian “comprehensives” which in turn is more restrictive than the “everything else” categories for the UK, Australia and New Zealand), but it’s close enough for jazz. The results are pretty clear: Canadian presidential pay is the lowest in the sample by a substantial margin, while Australia is the highest. Canada also has the smallest gap between presidential pay at highly research-intensive institutions and other institutions.
Figure 6: Cross-National Average Salary Comparisons, Clustered by Institutional Type
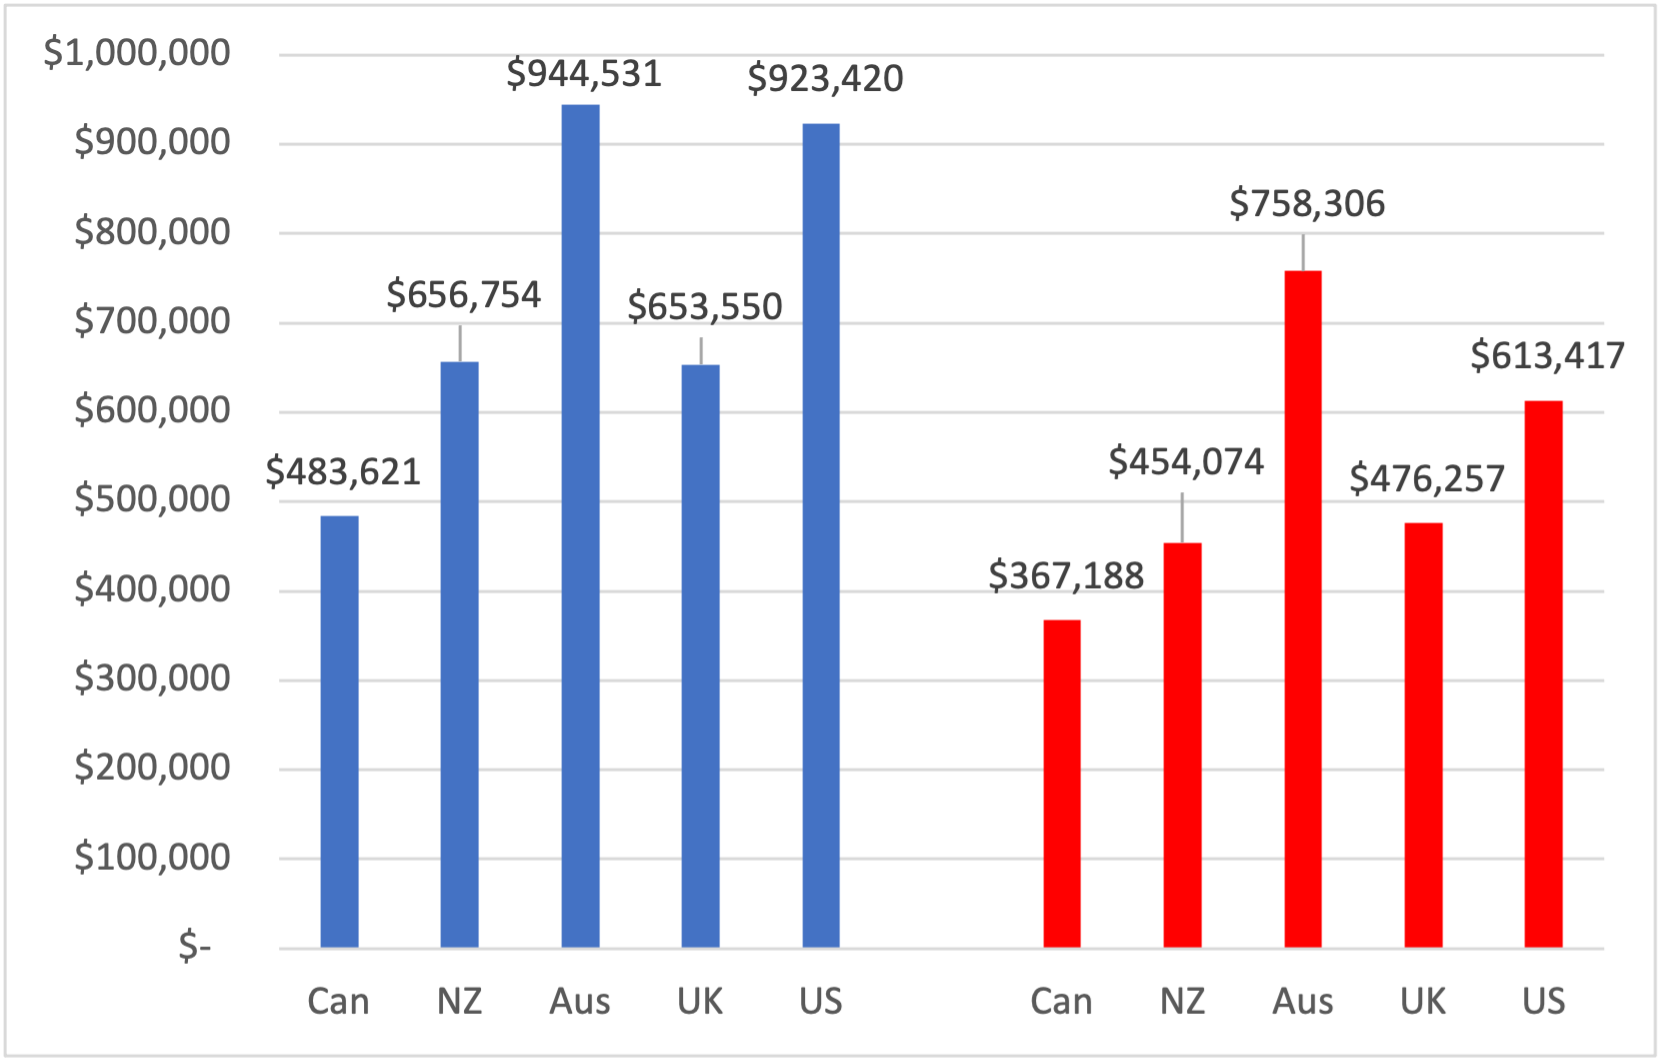
Looked at one way, Canadian university Presidents are a bargain. Looked at another, everyone else – especially Australians – are overpaying for executive talent. Eye of the beholder, I suppose. But either way, it’s hard to suggest that the pay of Canadian university Presidents is out of line with peer institutions in other countries.


5 Responses
I would agree that Canadian University Presidents are not overpaid for the level of responsibilities that they have. However, north of $650k looks quite steep even for Presidents of research intensive institutions (at least from down here…). And wow, the Aussie payday is a dream come true 🙂
Very interesting, and encouraging. Our national modesty seems to be leading us, as with our avoidance of stratification, to buck a pernicious international trend.
That said, I’m not sure how relevant international comparison are. We don’t usually measure executive compensation against international comparison, but against either responsibility (as Ray has done, above), or other possible priorities. Is the university president really worth as much as two new endowed chairs per year? As 24 full-ride ($20k) scholarships?
I’m not saying that s/he isn’t, but it’s the question to be asked.
It might be interesting to see comparisons of the growth/salary costs of the entire ‘C-Suite’ of Canadian universities. While the presidential salaries may be holding steady, what are the costs of the increased number of the president’s men and women it takes to ‘administer’ a university these days?
Thanx for this.
In the 1990s Australian governments sought to make universities more business like by cutting members from staff and students on universities’ governing bodies and increasing members from business. These are of course more used to very high pay for senior staff, and introduced pay consultants who commonly use benchmarking, which inflates pay:
Michael W. Gmeiner, Richard McManus and Adelina Gschwandtner (2024, January 16) Benchmarking leads to a dynamic of constant growth in university leaders’ pay,
https://blogs.lse.ac.uk/impactofsocialsciences/2024/01/16/benchmarking-leads-to-a-dynamic-of-constant-growth-in-university-leaders-pay
It might be interesting to see if other countries hire university presidents from the academic ranks, as is largely (or exclusively) the case in Canada, or if universities abroad are hiring business CEOs? Runaway growth of executive compensation packages in the Fortune-500 world has rightly come under scrutiny in recent years.
One other thing to ask about the salaries of university presidents in Canada and elsewhere is whether or not the total compensation is tied to any performance metrics? My understanding is that, at least in Canada, it is not. Forgive me if these things were discussed in your previous posts on this subject.