


All righty then: so far in this nutshell series we’ve avoided writing about the two “big” provinces, but since Ontario is going to the polls this week, we thought it made sense to tackle that province today, before we get to the manifesto.
Let’s start with student numbers. You need to remember that Ontario is big. Where post-secondary numbers are concerned, it has an even bigger footprint than it does in terms of physical size or population. 43% of all university students in Canada are in Ontario, and so are 42% of all college students. In total, the province hosted almost 800,000 post-secondary students in 2019-20, in a roughly 62-38 split between universities and colleges.
Figure 1: Full-time Equivalent Students, by Sector, 2000-01 to 2019-20
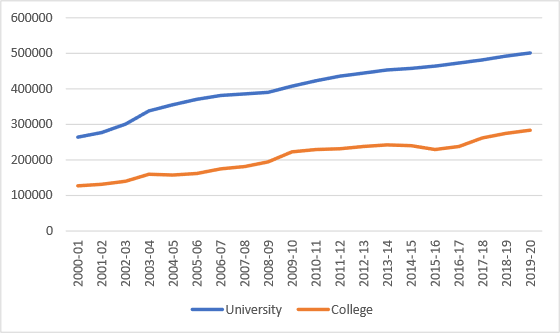
Figure 2: Indexed Full-Time Equivalent Post-Secondary Students, Ontario vs Other 9 Provinces, 2000-01 to 2019-20 (2000-01 = 100)
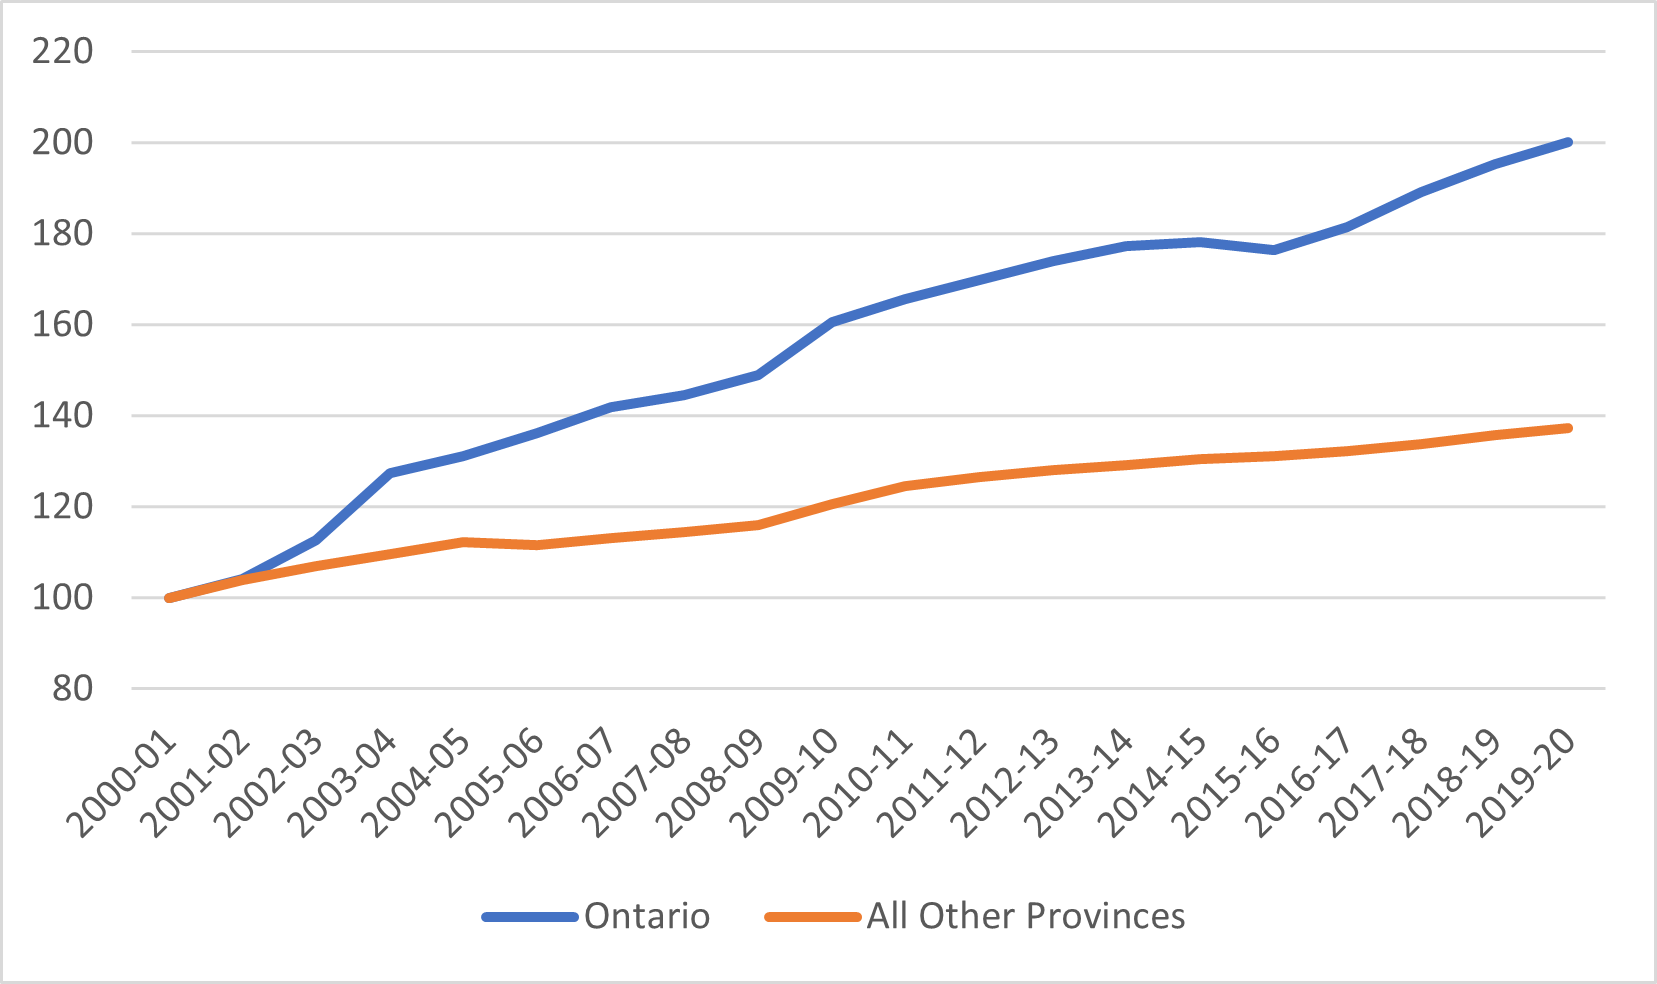
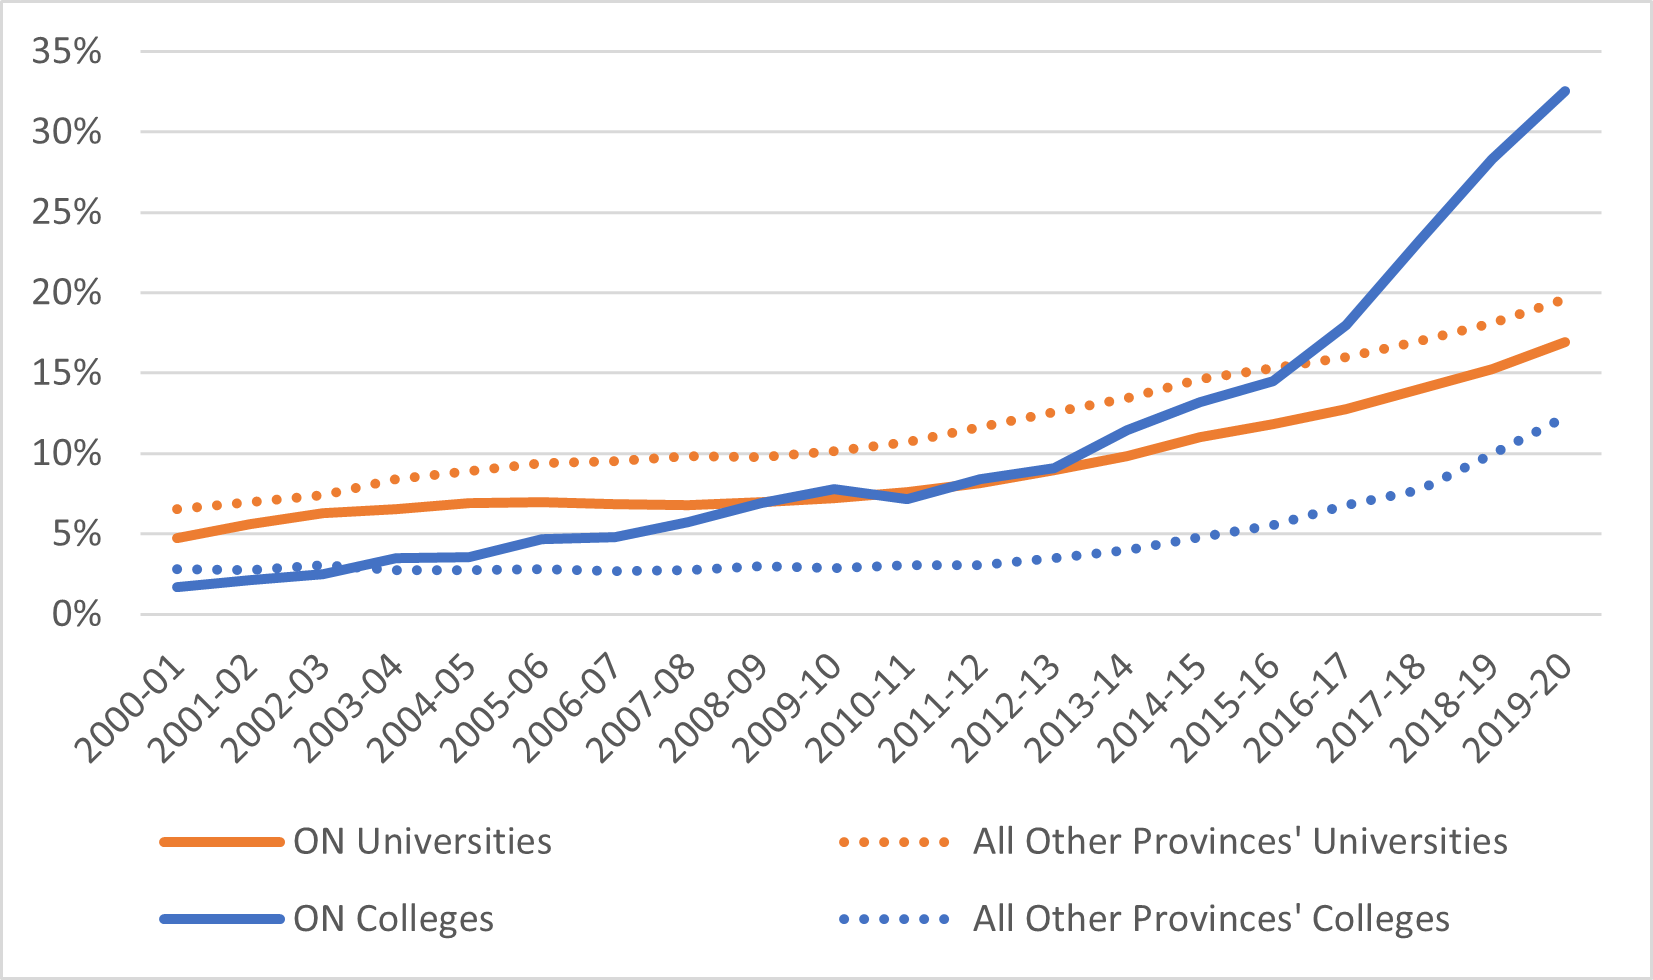
Figure 3: Proportion of Students from Outside Canada, by Sector, Ontario vs other 9 provinces, 2000-01 to 2019-20 (2000-01 = 100)
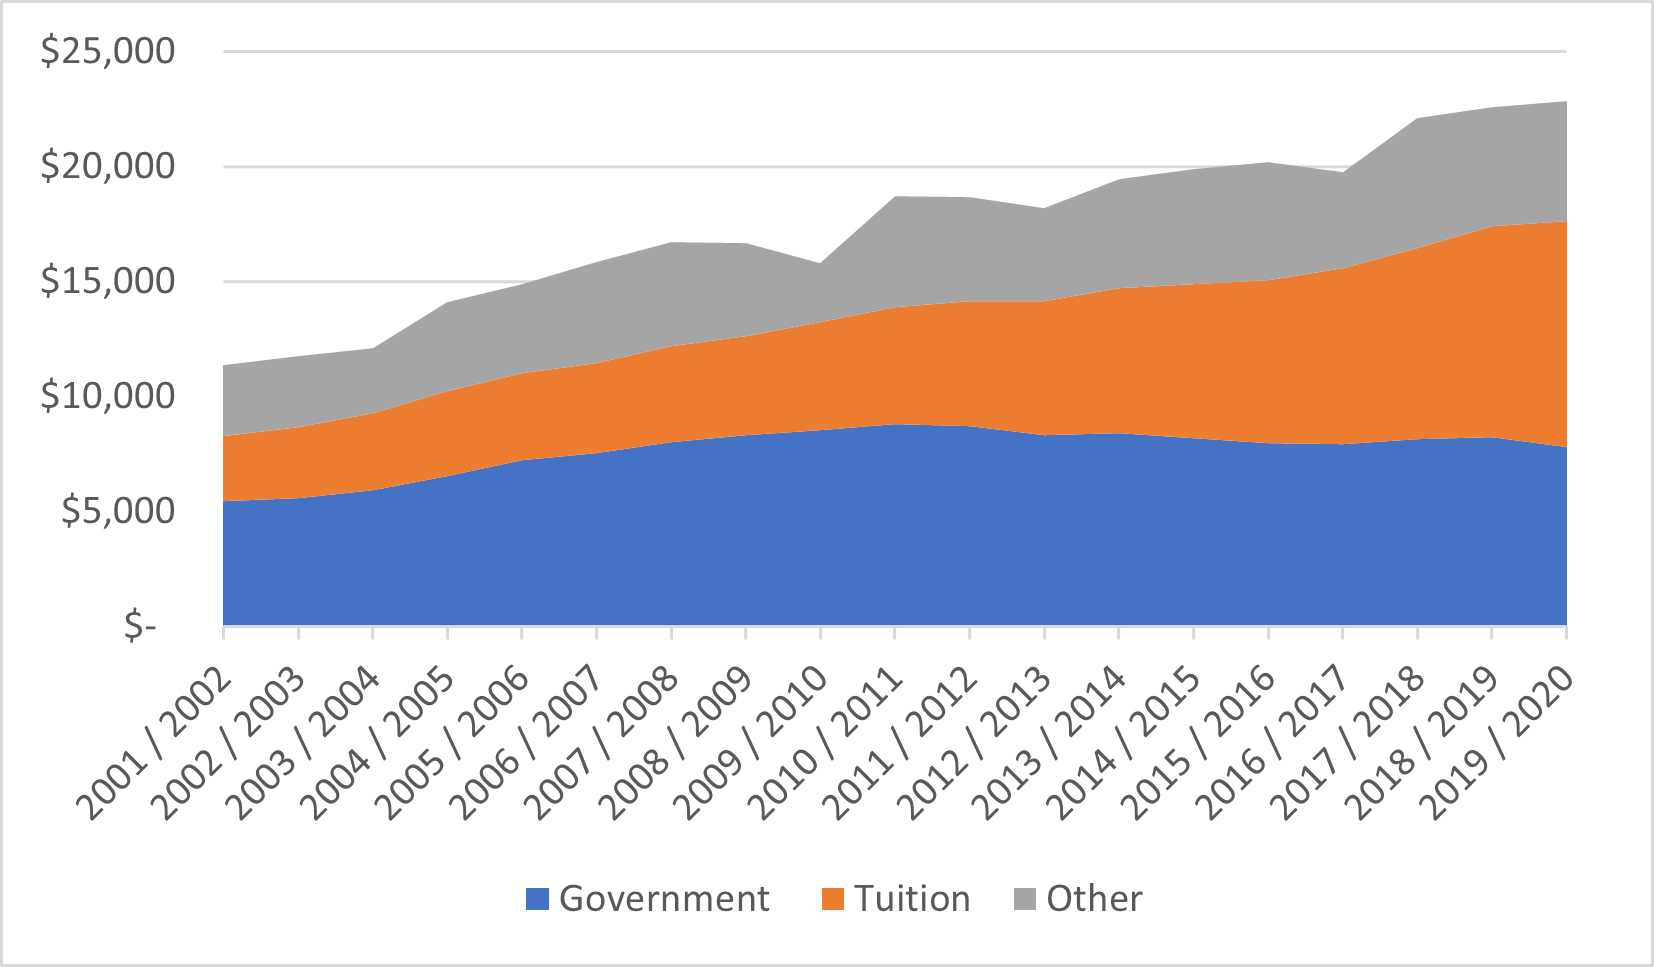
Ontario’s PSE institutions collectively took in a little under $23 billion in 2019-20. However, only 34% of this income came from public sources and just 26% from the provincial government. Not only is this the lowest percentage in Canada, but public funds have been dropping in real terms consistently for a decade now. Institutional underfunding is truly a bipartisan affair in Ontario. Conversely, the percentage of total income covered by tuition fees is 43% or equal to just a touch under $10 billion in 2019-20 – also the highest in Canada.
Figure 4: Total PSE Institutional Revenue by Source, Ontario, 2000-01 to 2019-20, in millions of constant $2019
As Figure 5 shows, overall growth in levels of public funding from government in Ontario outpaced that in the rest of the country for much of the oughts’, the result of major investments from the McGuinty government. But after McGuinty left office, funding began to fall, until by 2019-20 its 20-year growth rate equalled that of the rest of Canada (meaning: if you think Ontario is underfunded today, it was similarly true in the 1990s). But tuition revenue growth is a whole different story: in the rest of Canada it doubled, but in Ontario it more than trebled. This was not due to growth in domestic tuition: as Figure 6 shows, tuition in Ontario in 2021-22 was the same as it was a decade earlier, courtesy of the Conservative government’s 10% cut to tuition. In the college sector, it was primarily because of a major influx of international students; in the university sector it owed more to institutions’ ability to charge international students much higher tuition fees than those elsewhere in the country.
Figure 5: Indexed Change in Institutional Income from Governments and Tuition Fees, Ontario v. Other 9 Provinces, 2000-01 to 2019-2020 (2000-01 = 100)
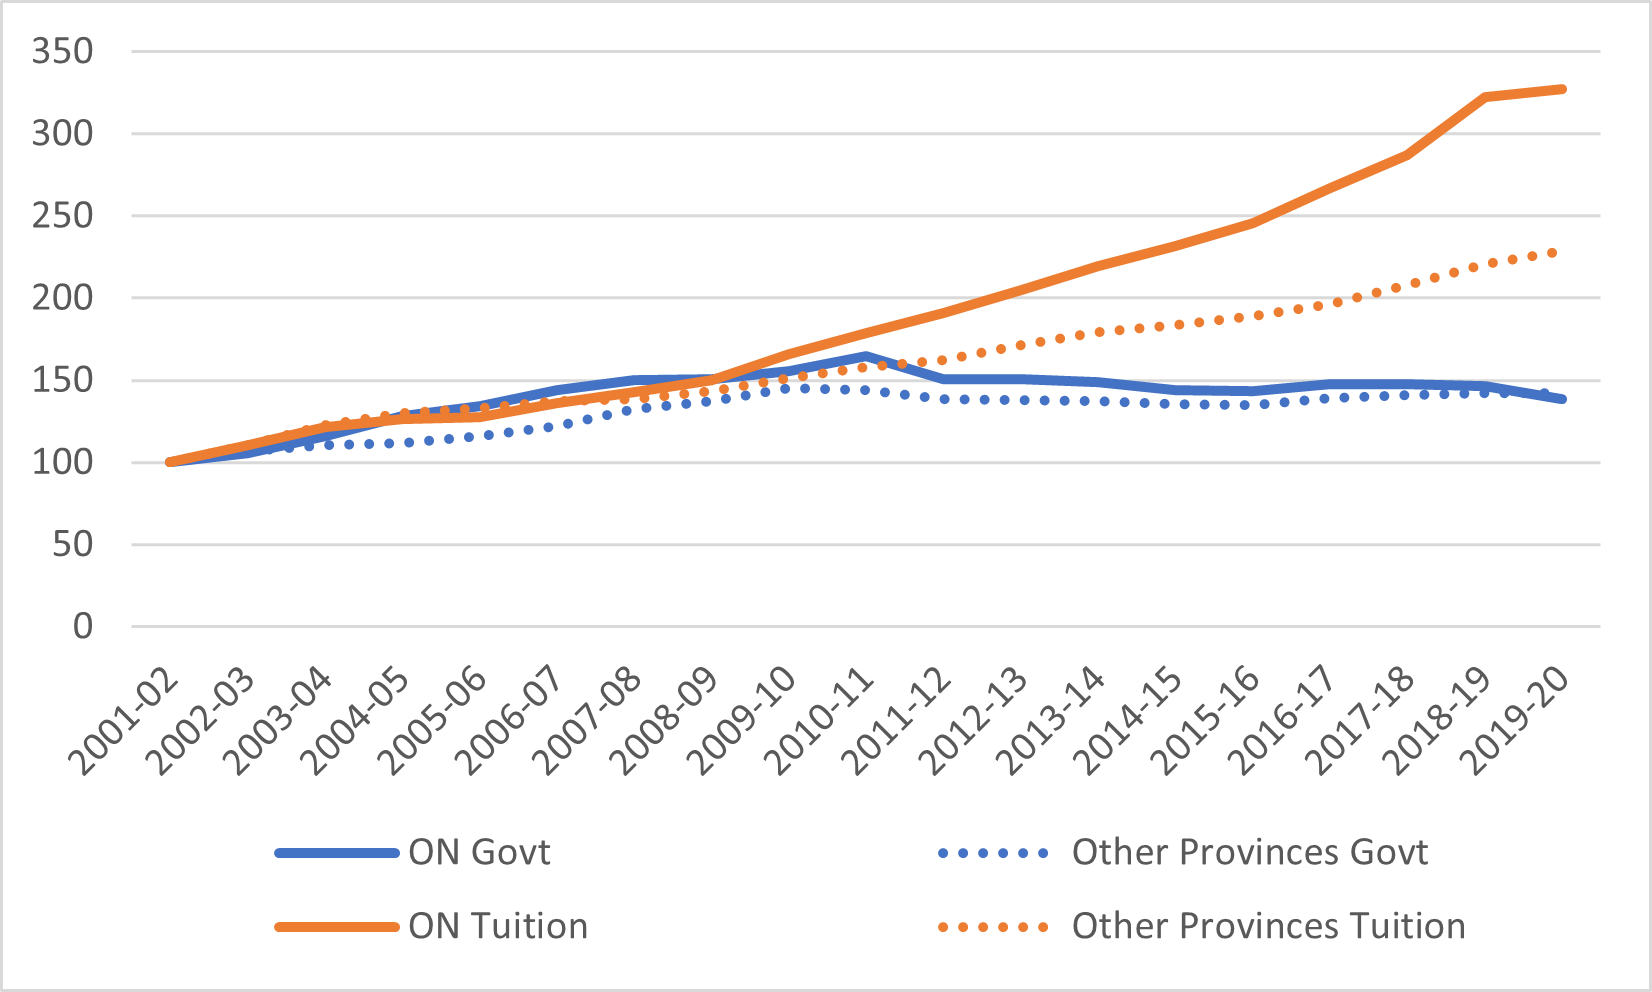
Figure 6: Tuition Fees, Ontario v. Canada, 2006-07 to 2021-22 (in constant $2021)
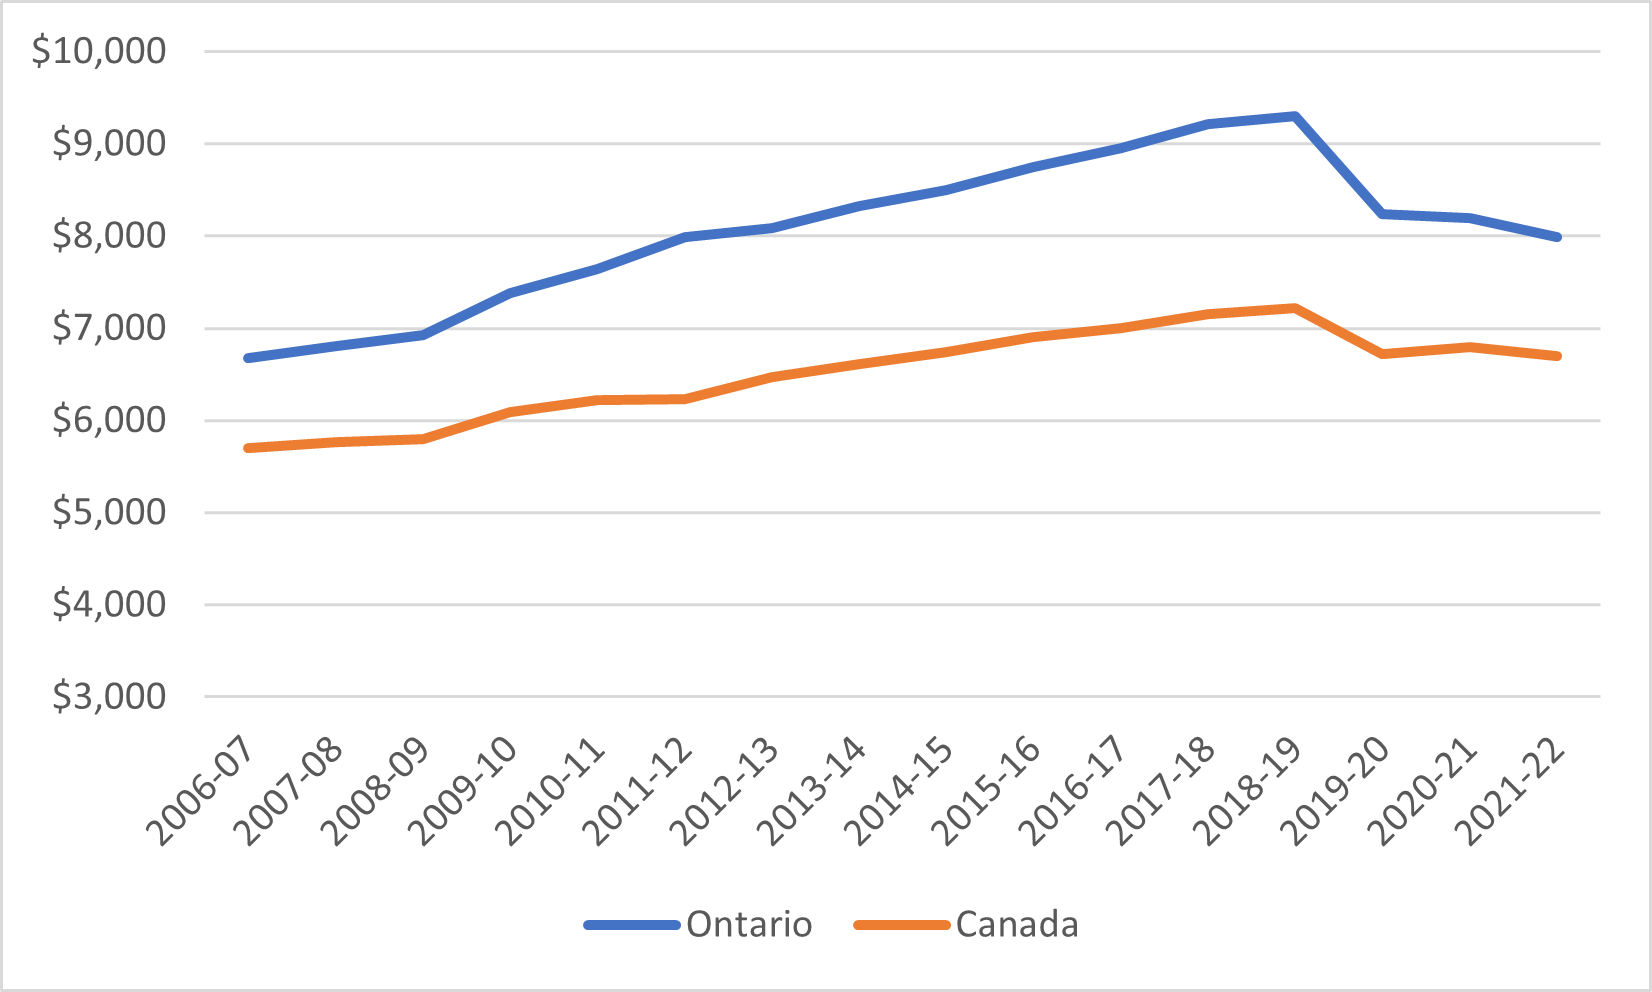
Figure 7 shows the average loan per recipient plus average grant per recipient over time in Ontario, from both provincial and federal sources (this is not quite the same as an average aid package because not all loan recipients also receive grants). In 2011-12, Ontario aid packages looked pretty similar to those in other provinces. However, once the Wynne government’s targeted free tuition program kicked in, things looked very different. Average loans suddenly became the second-lowest in the country (behind only Quebec), and grants rose to be 40% of the total aid provided, again second only to Quebec. Of course, as soon as the Ford government cut the program, aid packages snapped back to look more the way they did a decade earlier.
Figure 7: Average Loan Plus Average Grant Disbursed, Ontario, 2011-12 to 2019-20, in constant $2019
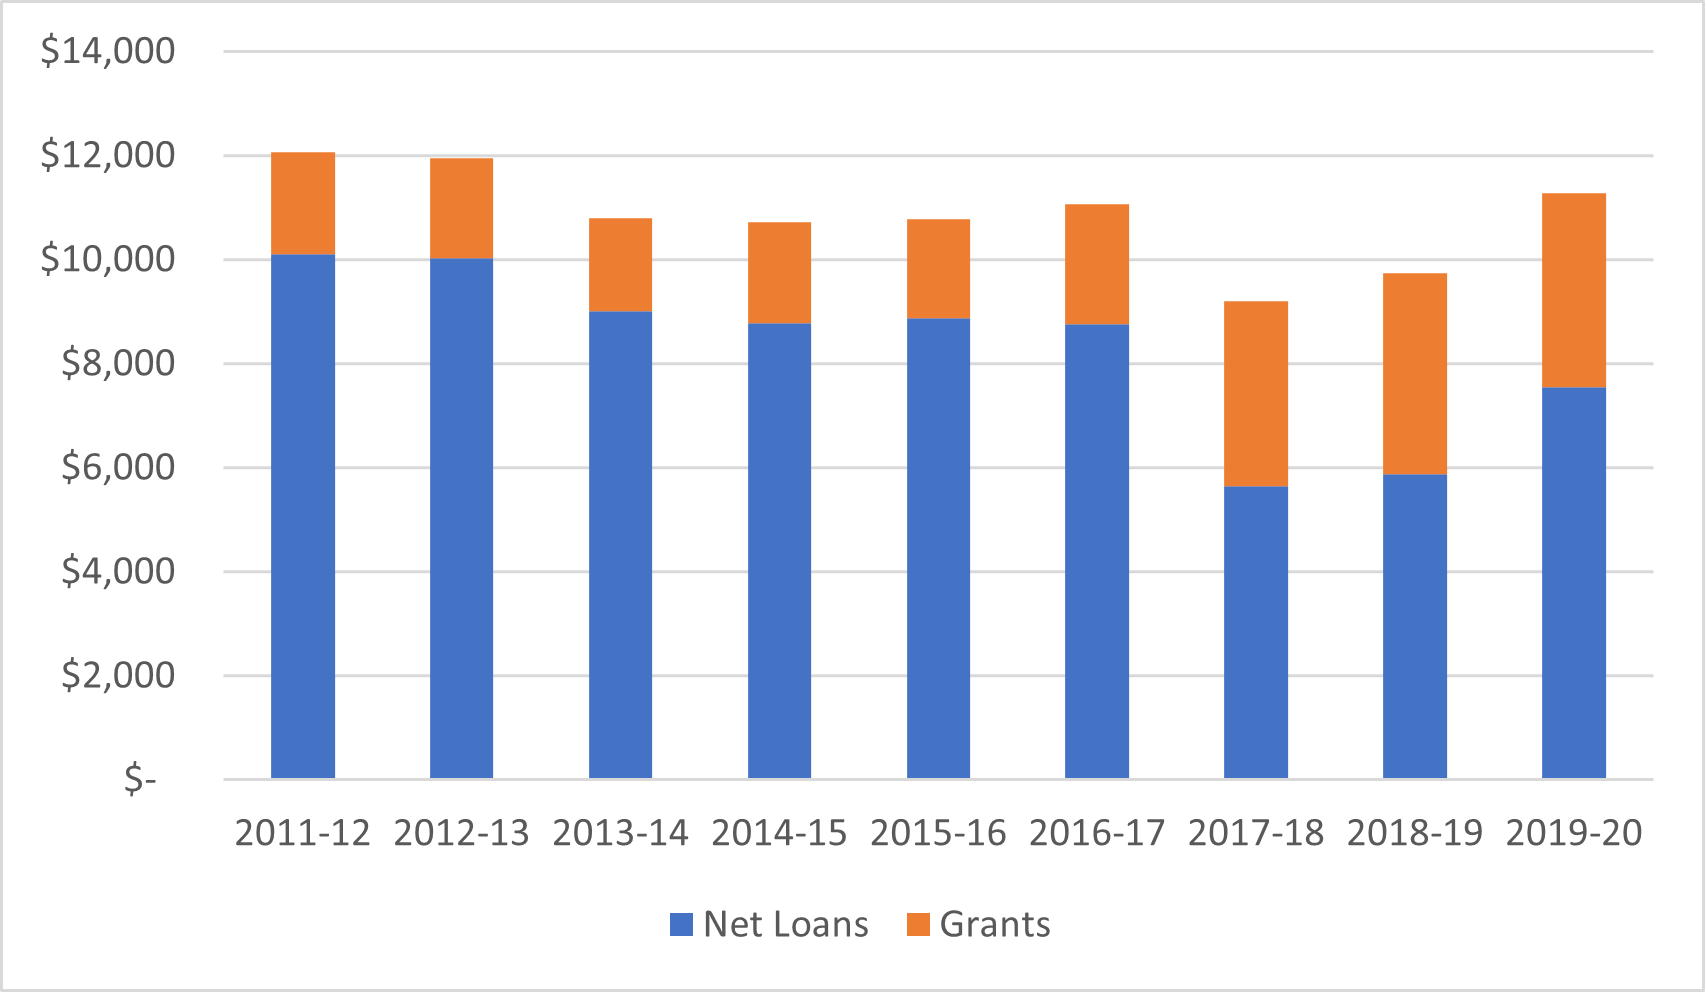
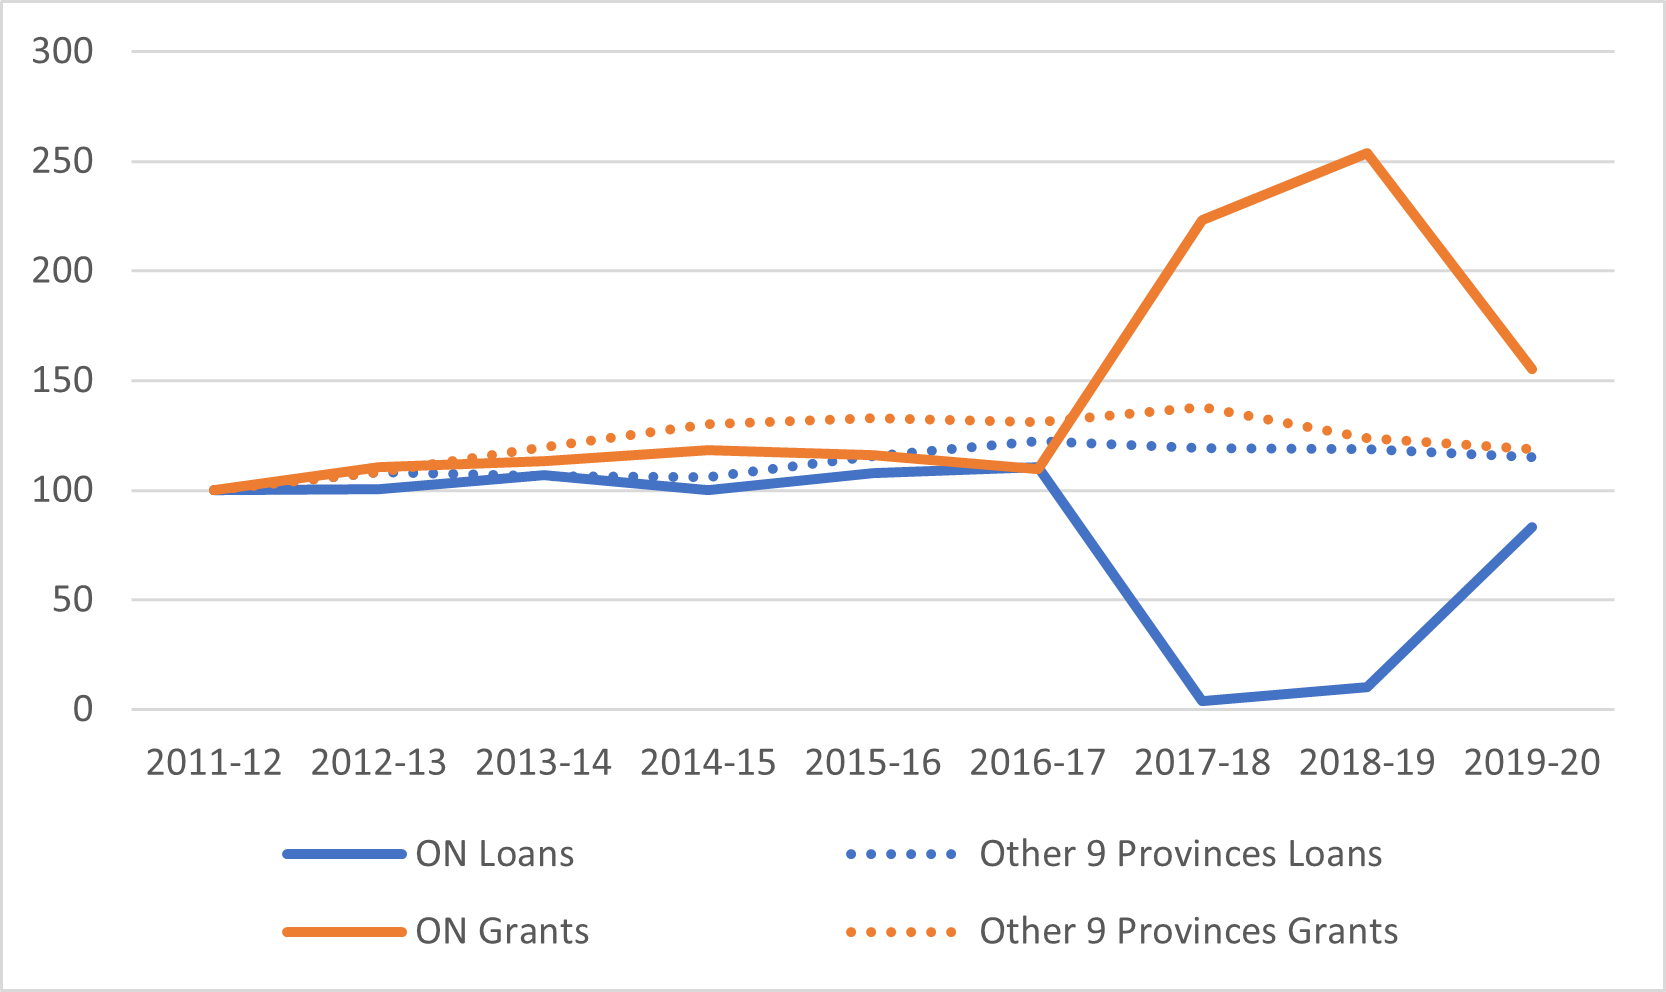
Figure 8 looks weird, but that’s because of how large the policy pendulum swung between the introduction and elimination of targeted free tuition. At one point, loan volume in Ontario fell to just 4% of its 2011-12 level. Still, even after the elimination of the program, Ontario grant expenditure in 2019-20 grant disbursements were substantially higher relative to 2011-12 than they were elsewhere in the country and loan disbursements were substantially lower.
Figure 8: Indexed Change in Total Real Provincial Loans and Grants Disbursed, Ontario vs. Other 9 Provinces, 2011-12 to 2019-20 (2011-12 = 100)
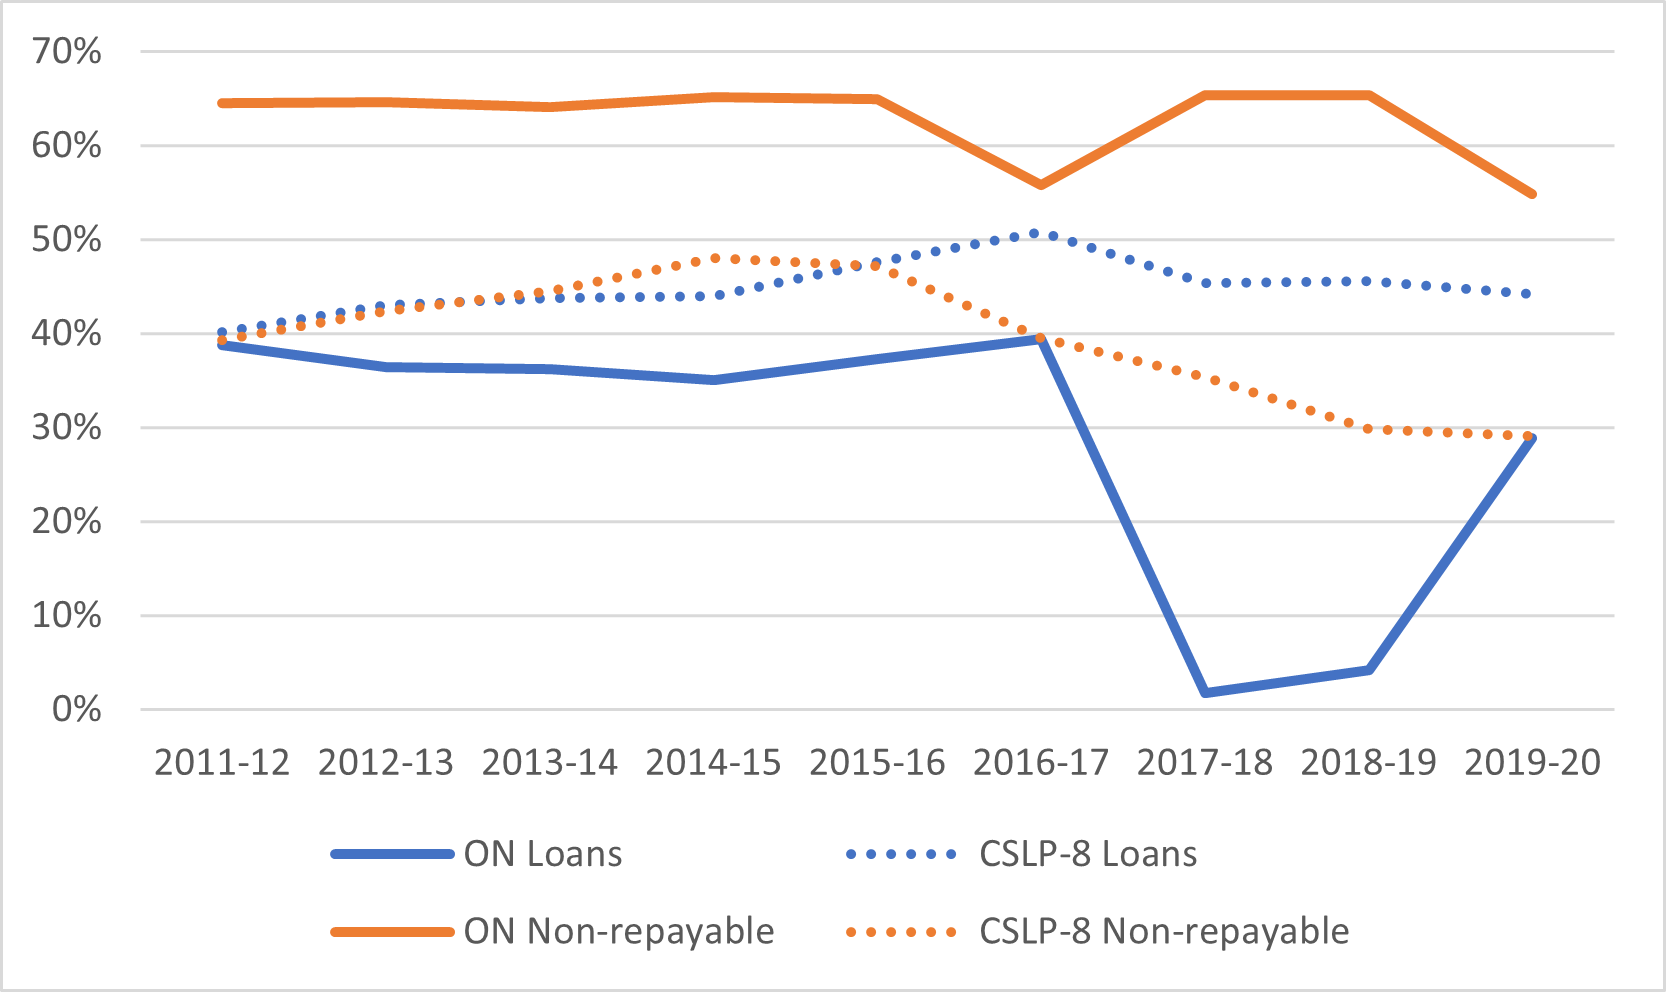
Finally, Figure 9 looks at how much of the province’s student assistance comes from provincial as opposed to federal sources. For this exercise, I compare Ontario to the other eight provinces which participate in the Canada Student Loans Program, again excluding Quebec. What we see in this figure is that where loans are concerned, Ontario contributes less to total loans than other CSLP provinces (29% vs 44%), and has done so for the entirety of the past decade (indeed, in 2017-18, just 2% of all student loans in Ontario came from the province) . However, with respect to grants, it issues considerably more: in 2019-20, the province issued 55% of all non-repayable aid in the province, compared to 29% in the other 8 CSLP provinces. Ontario is a high-tuition province for sure, but it is also a high-aid one.
Figure 9: Provincially-Funded Loans and Grants Disbursed as a Percentage of Total Loans and Grants Disbursed, Ontario vs. 8 other Canada Student Loans Program Provinces, 2011-12
So that’s Ontario in a nutshell. Tomorrow we’ll look at the province’s future when we analyze the province’s party political manifestos for Thursday’s election.

