


NOTE: Please see this blog for a correction to the U of T numbers.
(I promise this is the last one.)
Here is the graph from yesterday and last Wednesday, on academic and non-academic staff numbers, only this time with UBC included because the folks there kindly sent me their numbers.
Figure 1: Percentage Growth in Academic vs. A&S Staff numbers, Self-Selected Institutions Which Publish Staffing Data, 2010 to most recent year available
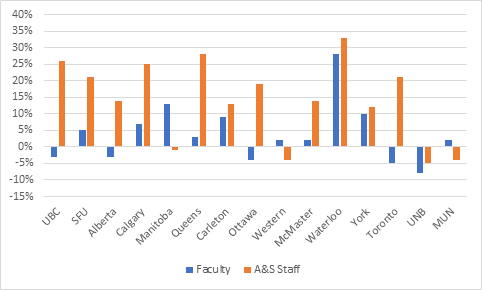
Yesterday, I pointed out that this picture of (mostly) big comparative increases in administrative & support (A&S) staff numbers didn’t seem to be accompanied by a big increase in A&S staff aggregate salaries. But I didn’t do the hard work to make that an apples-to-apples comparison – one source was institutional, and one was national. So, today, I am examining these fifteen universities to give you a better sense of what is actually going on: and, believe me, at fourteen of the universities, this story is not going to reinforce the “omg, the bureaucrats are taking over” storyline.
Now, just so we are clear about what I am doing here. I am taking self-reported data on academic staff numbers and A&S staff for 2010 and for the most recent year available at each institution, which is usually either fall 2018 or fall 2019. The admin and support staff numbers include senior admin like Presidents, VPs and Deans, who are technically “academic staff”. On the other side of the equation I am looking at the changes in salaries based on data from the 2009-10 and 2017-18 Statscan/CAUBO Financial Information of Universities and Colleges (FIUC) Survey. Two things: in a couple of cases, the years do not quite line up so it’s not a perfect comparison. Second, the FIUC salary data tends to roll up wages in a way that includes Deans and other senior admin on the academic side (basically, if your salary comes from an academic unit and you have tenure, your wages are “academic wages”). Now that maybe affects 0.5% of total employees at each institution, but it does mean that compared to staff numbers, staff aggregate salaries are going to look a smidge higher than they should if it were a perfect comparison.
So, let’s start by looking at the University of Toronto. According to the data from last week, U of T was one of the “baddies”. Not only had the number of administrative and support staff risen by 21% over eight years, but the number of academic staff had decreased! Boo hiss! But when you look at what they are spending on A&S staff vs. academic staff, you get a completely different picture. For A&S staff, the total spending on salaries rose 35%, in constant $2017. For academic staff, aggregate spending rose 30% even though the number of staff members declined.
Figure 2: Growth in Staff Numbers and Aggregate Salary Expenditures, Academic Staff vs. A&S Staff, University of Toronto, 2010 to most-recent year available
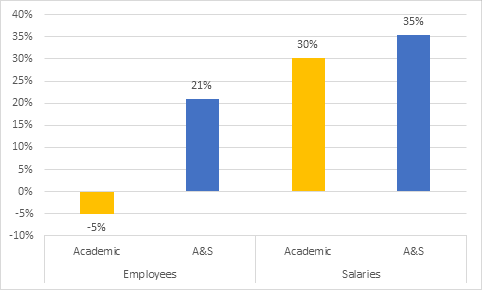
What’s partly going on here is that individual salaries are lower for A&S staff than for academic staff, so A&S staff can be added more cheaply. But partly it’s a matter of turnover. Say a non-academic staff person switches jobs every three years. That means every three years a manager can re-set that salary at a lower level within the salary grid because the incoming person will not have the three years of accumulated seniority. But academics…well, they never retire, right? So, their salaries keep growing and as a result, if you look over time, the average pay for a faculty position rises much faster than a non-academic position simply because one resets, and the other does not. This is how aggregate academic pay can rise almost as fast as aggregate A&S pay, even though A&S staff are growing more in terms of numbers.
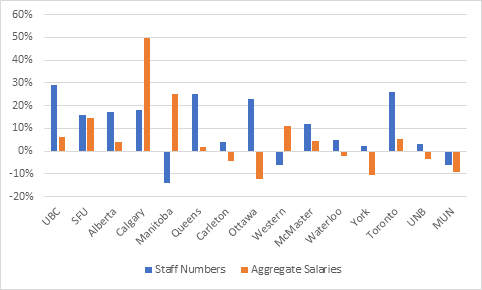
I am not going to do a Toronto graph for all fifteen institutions, because you aren’t going to scroll through something that big. Here’s what I am going to do instead. For each institution, I am going to compare percentage point differentials for the change in Academic vs. A&S staff numbers and Academic vs. A&S pay (this is a bit clunky, but bear with me). To take the Toronto example above, the staff number differential is 26 (21 minus negative 5) and the salary differential is five (35 minus 30). That way you can see the relative extent to which different universities are favouring non-academic staff in terms of both staff numbers and aggregate salaries. Bars which go above the line mean the balance is in favour of A&S staff; bars which go below the line mean the balance is in favour of academic staff.
Got that? OK, here are the results.
Figure 3: Percentage Point Difference in Aggregate Growth Between Administration & Support Employment and Salaries and Academic Employment and Salaries, Selected Institutions, 2009-10 to 2017-18.
Here’s what you should take from this graph (which, I know, awkward, sorry):
- There are three universities where the number of net new academic staff since 2010 exceeds the number of net new A&S staff, the ones with blue bars below the line – Manitoba, Western and MUN.
- There are five universities where aggregate academic salaries since 2010 grew faster than aggregate A&S salaries, and those are the ones with the orange bars below the line – Carleton, Waterloo, York, UNB and MUN (note, MUN is the only institution where academics > A&S on both counts)
- At twelve institutions (the exceptions are Calgary, Manitoba and Western), the data looks a lot less rosy for A&S staff (and hence, comparatively better for academic staff) if your comparison is based on aggregate salaries rather than staff numbers.
- Manitoba and Western seem to have some kind of strategy which keeps A&S staff numbers constant but pays them more; Calgary has been on a path of both hiring more A&S staff than academic staff and putting them on faster rates of pay raises than academic staff.
One point worth underlining. It’s not just that academics are more expensive than A&S staff, it’s that the lack of churn in their ranks over the last decade has made the rate of average salary increase much higher than that of A&S staff. This is why, even though at most institutions the rate of aggregate salary increase between the two sectors is very similar (there are only three institutions where the gap is more than 0.5% per year), you end up with hugely different employment patterns. And that’s before you deal with changes in stakeholder demands and changes in the regulatory environment such as more student counselling and health services, more need for dealing with a marketized environment (recruitment, marketing, branding) and responding to more oversight and accountability demands from government.
Put all of that together and you’ve got a pretty good handle on why we’re seeing administrative staff grow more quickly than academic staff. The relative sizes of the two groups are changing; but most factors behind this change can be explained relatively easily, and it’s not clear (to me, anyway) that at most institutions what you are seeing is in fact “bloat”.
(There is, of course, a question of where in the institution the A&S staff are. Some academic staff claim to me that the real problem is not so much the number of staff than that their location within the institution is changing, that they are increasingly located in central admin and not faculties. That may be, I can’t tell because the institutional data, with one or two exceptions, is not nearly detailed enough to provide an answer one way or another. My guess would be that it’s more likely that a rebalancing of A&S staff between faculties – that is, away from Arts and towards STEM – is at least as big a cause. But I can’t prove it).
Ok, I’m done on this topic for a few years, I think. Thanks for putting up with me going down this rabbit-hole.


One Response
“Some academic staff claim to me that the real problem is not so much the number of staff than that their location within the institution is changing, that they are increasingly located in central admin and not faculties.”
Let me add my voice to theirs: the greater staff aren’t to help with research and teaching but with, as you say, “marketization.”
In arguing that more staff might produce more fundraising, and therefore not be a drain on resources, I think that you’re kicking in an open door. I don’t think many people particularly mind the cost of administrative, but the implication that we’re changing from collegially-governed institutions, dedicated to pursuing all the knowledge in the universe as an end in itself, to centrally-managed bureaucracies, dedicated to providing whatever goods and services are likely to prove popular with government or the market. (Spoiler alert: it’s unlikely to be humanities).
From this point of view, “marketization” isn’t so much an explanation as a naming of the problem. And administrative bloat is its symptom.