


Just a quick blog today as things are kind of hopping at HESA Towers this week (literally, in the sense that the floor shakes a bit with the new construction). It’s about how to measure revenue in Canadian higher education.
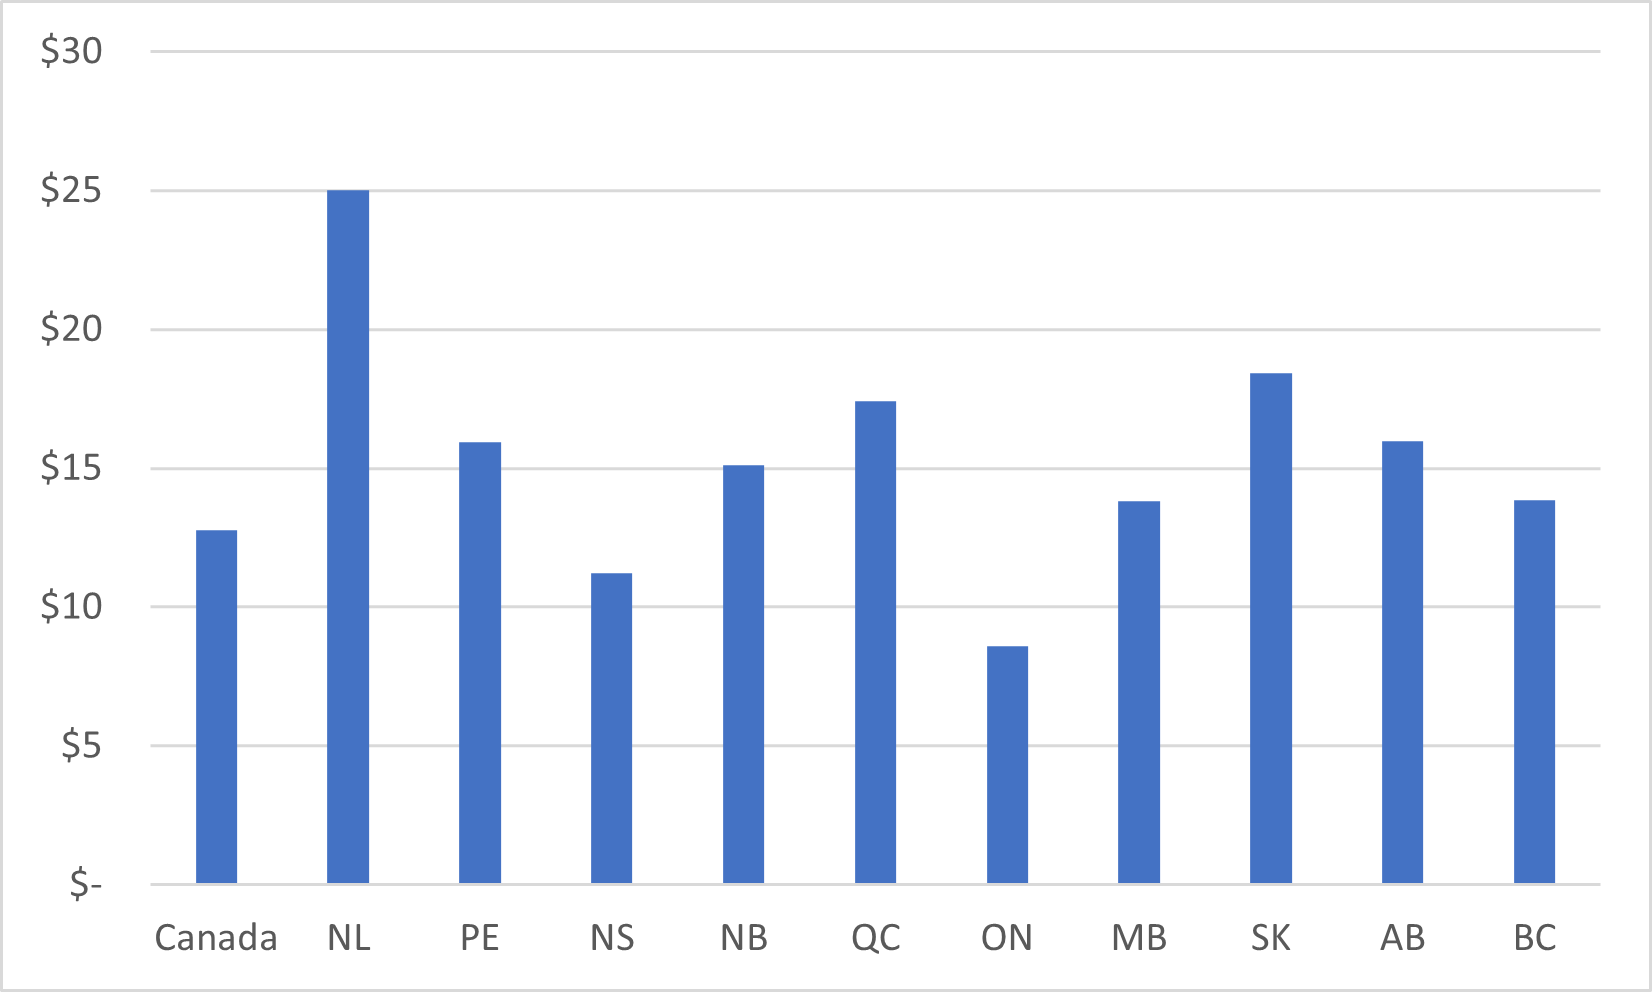
Long-time readers are used to me publishing data like that in Figure 1, which shows provincial government expenditure per student. The usual conclusion everyone draws from this graph is “holy cow, Ontario is run by monsters” (to which the answer is yes, but it’s always been like this and low funding of higher education is a thoroughly tri-partisan affair).
Figure 1: Provincial Government Expenditure per FTE Student, in thousands of $s, 2019-2020
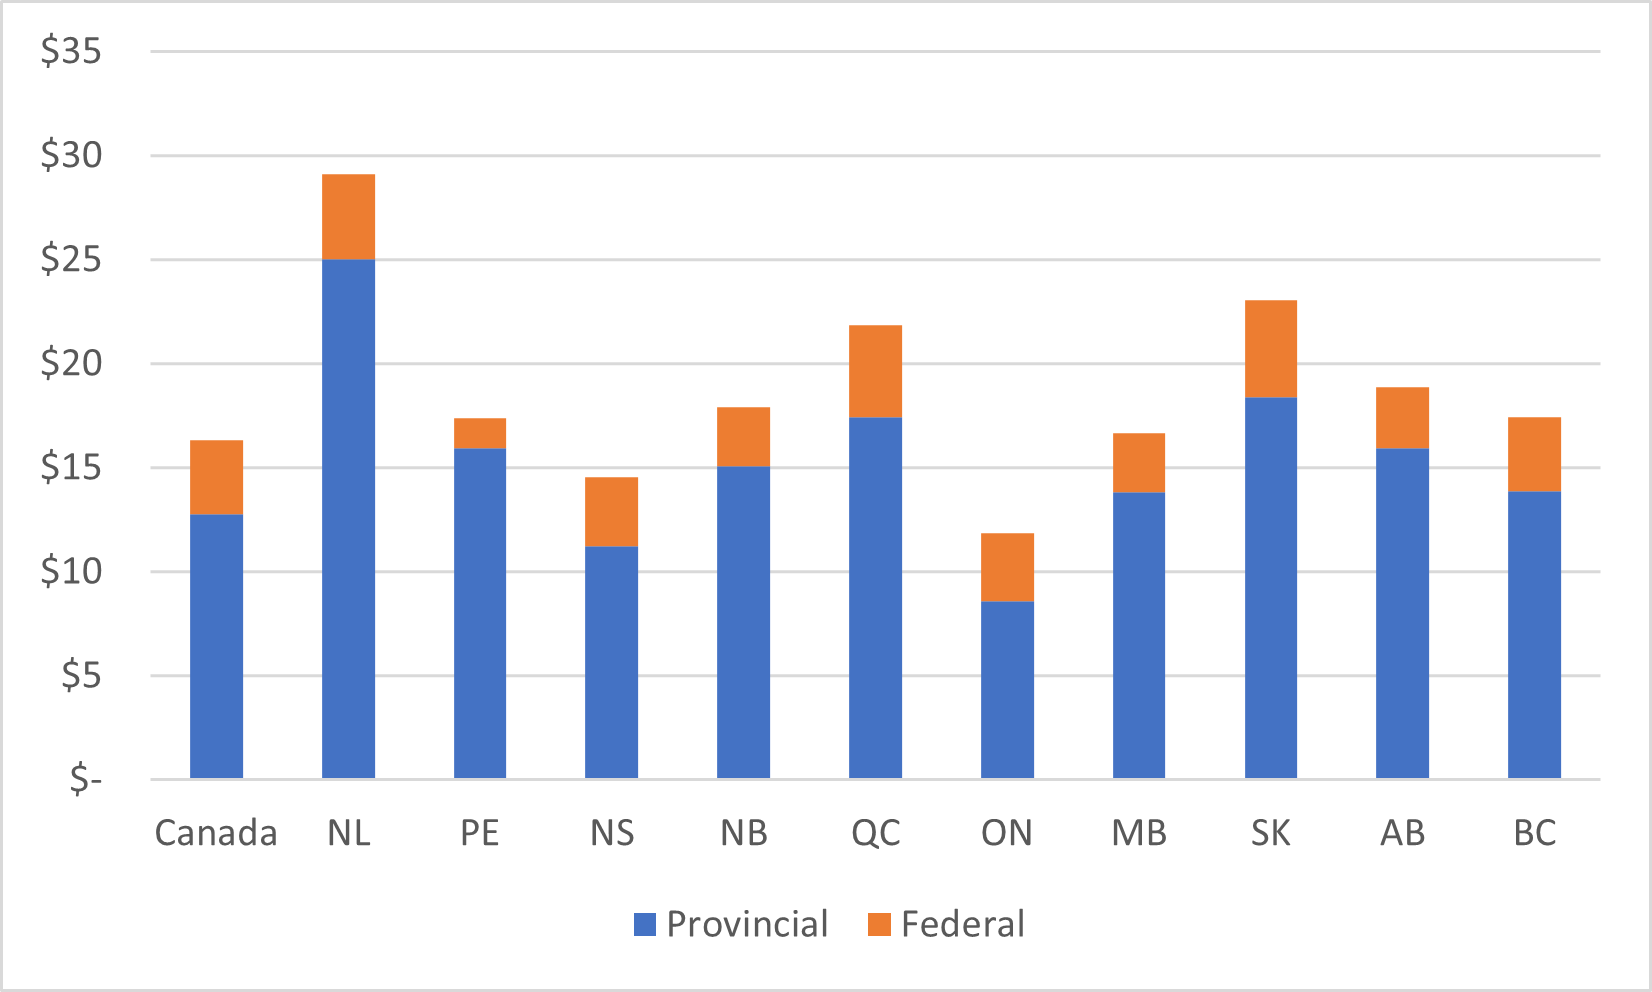
It’s a little bit different if you add federal expenditures, but not much.
Figure 2: Provincial plus Federal Expenditures per FTE Student, in thousands of $, 2019-2020
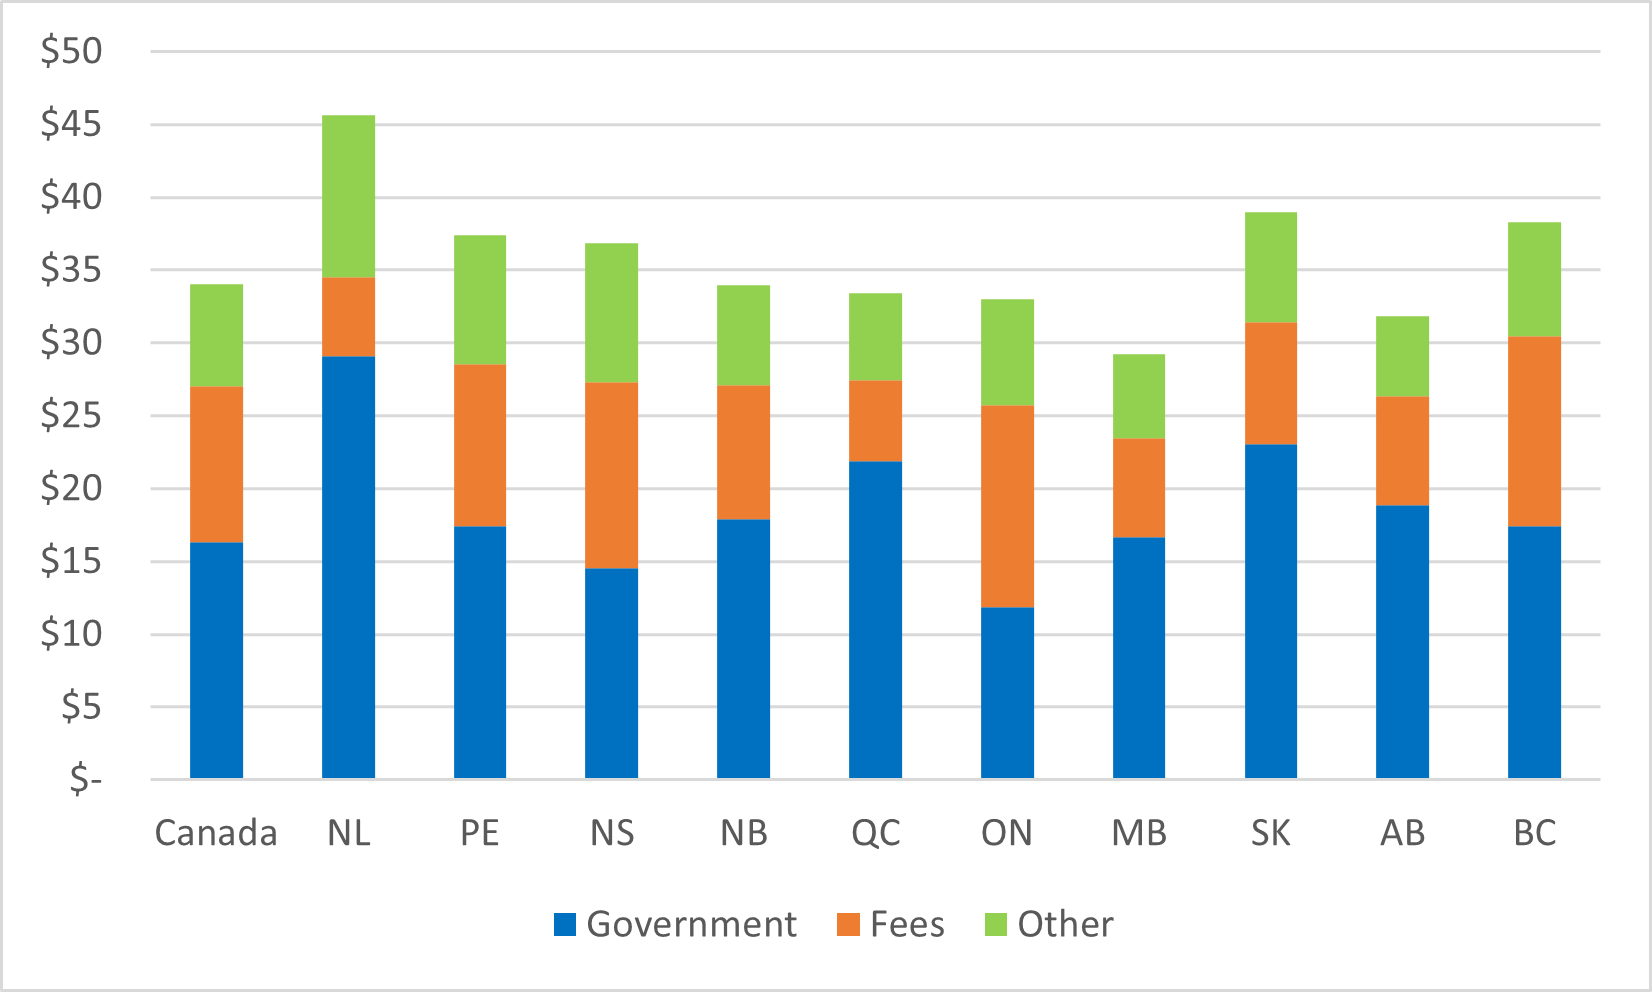
Where it all starts to change is when you start adding in tuition revenues and revenues from other sources. When you put these things into the mix, you get a very different picture. Back in Figure 1, dollars per student ran 2:1 in favour of Quebec over Ontario; when you look at Figure 3, revenues per student in Quebec and Ontario are exactly the same. Only BC, Saskatchewan and Newfoundland appear to be above average (and in Newfoundland’s case that’s mostly because the province runs a not-insignificant portion of the provincial health budget through Memorial’s Faculty of Medicine). Certainly, what Figure 3 shows is that total revenues per student are more consistent across provinces than government revenues per student.
Figure 3: Total Revenue per FTE Student, in thousands of $, 2019-2020
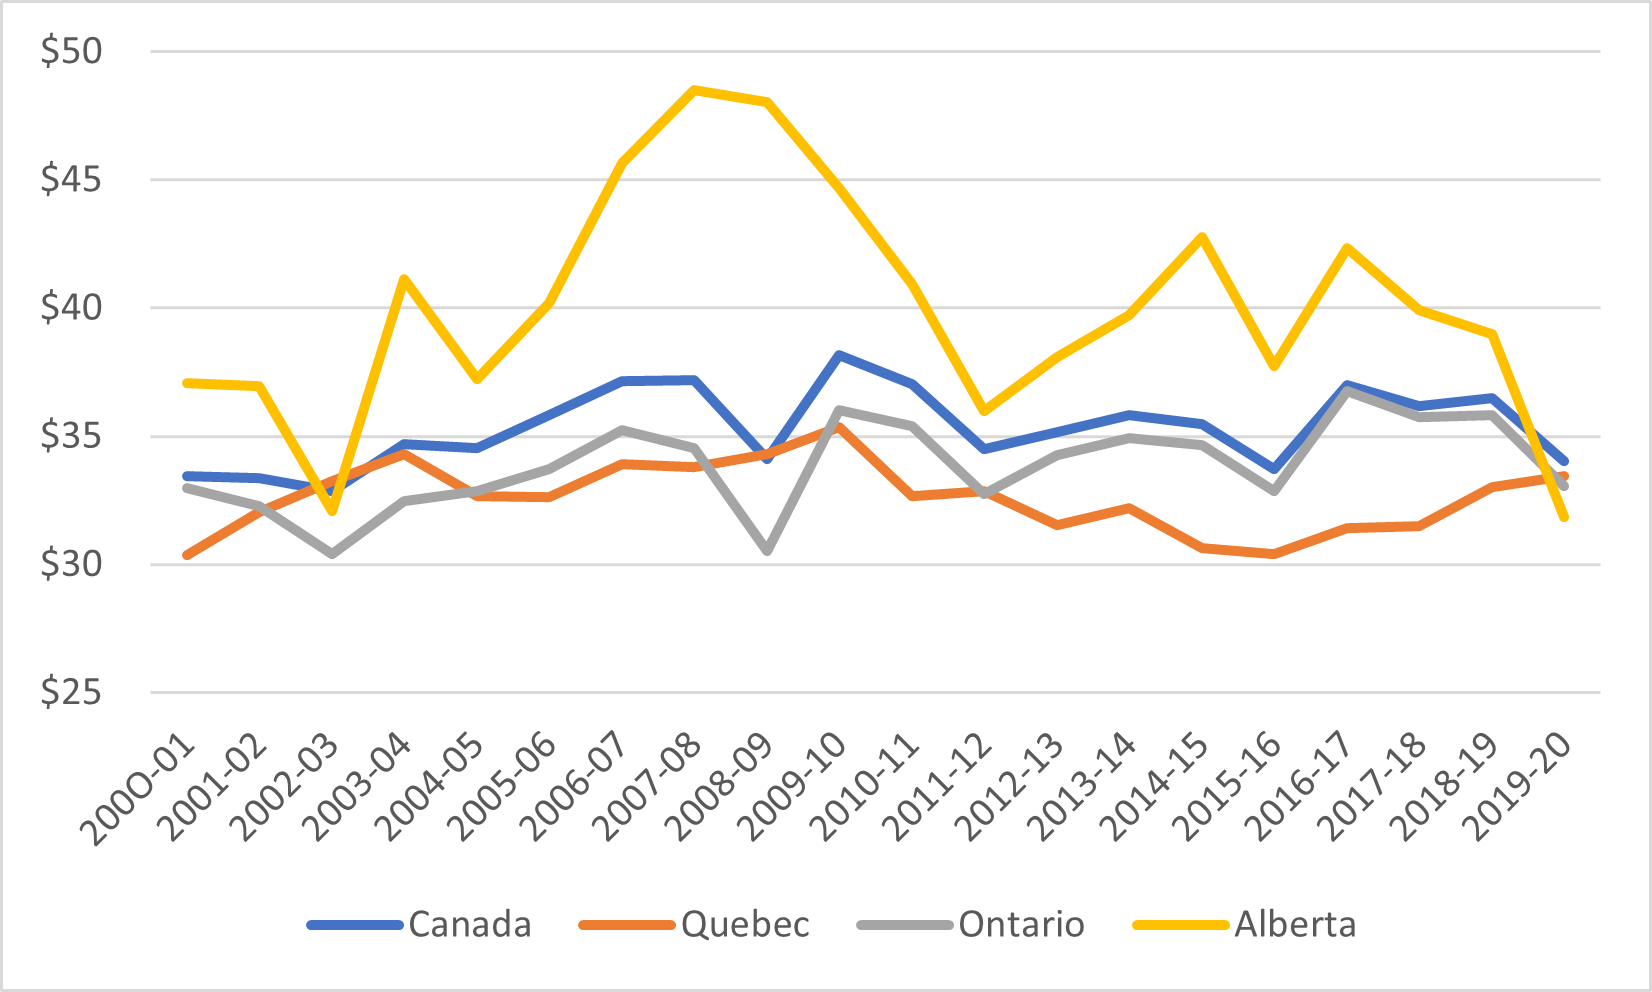
Now one thing the eagle-eyed among you may notice here is that Alberta is not way above the national average, the way the provincial government has often claimed over the last couple of years. And there’s two reasons for that. The first is that 2019-20 was a year of serious government cutbacks, and the second is that most of the revenue-generating measures that institutions were given power to use (mainly tuition fees) have not kicked in yet. If you take the long view, Alberta has been better-funded than anywhere else in Canada. But if you take the short view – that is, the last couple of years – you see that Alberta is an absolute disaster, falling from over 20% above the national average in 2015 to 5% below it in 2020. Whatever you think about how well-funded Alberta universities were a few years ago, 2019-20 was a heck of a come-down. Figures will presumably bounce back in subsequent years, but 2019-20 was indeed a tremendously difficult year in Alberta.
Figure 4: Total revenues per FTE student, selected provinces and Canada, 2000-01 to 2019-20
Now, all of the foregoing assumes that FTE students are the correct denominator for examining the relative affluence of provincial systems of education. But what if it is not? What if, instead, we described revenues in terms of dollars per professor, since academic labour costs form the largest portion of academic expenditures. Well, now this looks quite different: all of a sudden Ontario looks quite munificent – $1 million per TT prof is a hell of a state and it’s New Brunswick that suddenly looks like Confederation’s miser.
Figure 5: Revenue Per Tenured or Tenure-Track Professor, by Source, Canada, 2019-2020
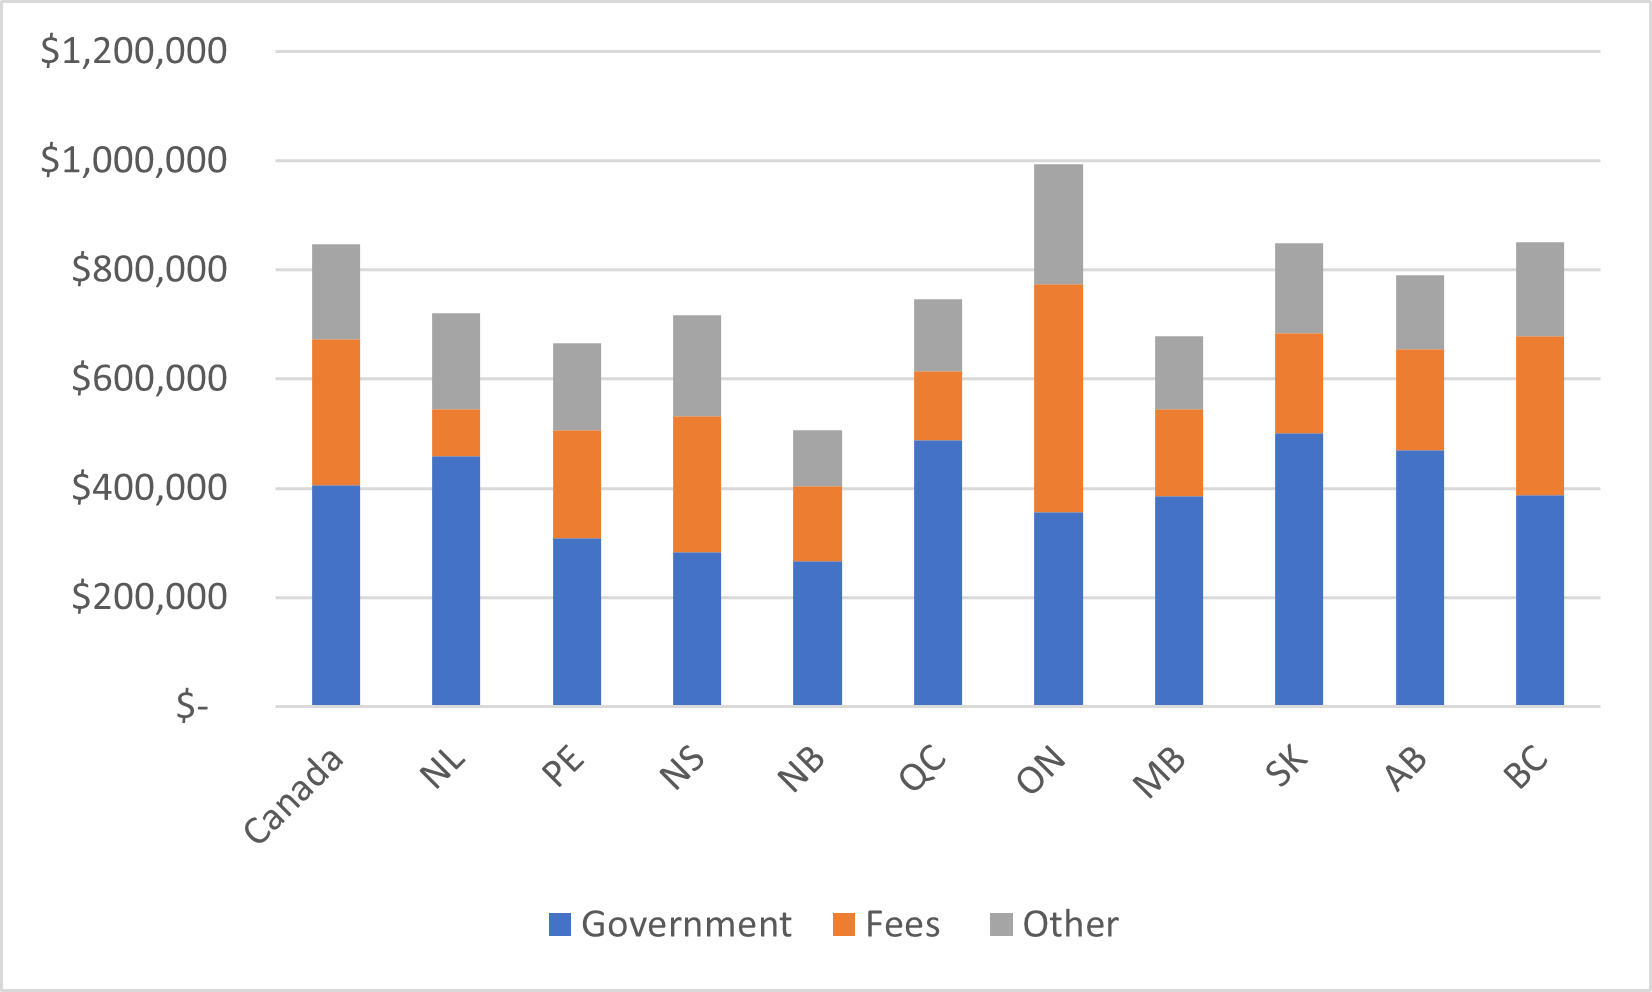
Figure 5 probably explains a great deal about the differences in faculty salaries across the country. Basically, if you maximize both international student numbers *and* the use of sessionals, faculty can find themselves pretty well-off.
I’ll be doodling more with this kind of data in the weeks to come. Hope you’ll join me in doing so.


5 Responses
Hi,
Are there differences in terms of student/prof ratio that could explain such a shift?
Regards,
This is an interesting one – playing around with denominators. Most recently, with this list https://researchinfosource.com/top-50-research-universities/2021/list, universities are now boasting the highest research intensity per faculty, or per graduate student. Given the sizes of the denominators, just having fewer graduate students makes for a much bigger number there – so if you’re hiring more Technicians or Postdocs, you’re boosting that score. Now, that’s not to say that graduate students suffer from this – more support staff and senior trainees around you is probably a nice boost – but I’m not sure “research money per graduate student” is a metric that means… well… anything concrete to… well… anyone?
Does this correct for sessionals and adjuncts? In institutions where sessionals are a major instruction force, that may skew these numbers considerably. What about $ per instructor, since instruction is where the majority of student/professor interaction is?
Regarding Figure 5 Revenue Per Tenured or Tenure-Track Professor, by Source we should keep in mind a lesson learned from what we know about peer selection analyses: program array makes a big difference in comparing universities. A university with, for example a medical school, will have a salary and revenue structure very much unlike universities without high fee/high cost/ high public subsidy programs. This is why, at least in theory, in Macleans’ rankings York is classified as “comprehensive” and McMaster as “medical/doctoral.”
Thank you and the HESA team for your valuable contribution to our understanding of local and global higher education (HE). In my work, I rely on the data analyses and discussions HESA provides. In this post you offer an alternative way to look at institutional revenue – using professors as the denominator.
Essentially, I have used this denominator to create an alternative, full-service HE model – one that offers far greater access, faculty compensation, research funding, system-wide funding stability, and more, for no more than half the current revenue of universities and colleges in Canada. I invite you to consider this model, which I have called, Professional Society of Academics (PSA): http://bit.ly/ProfessionalSocAcademics.
Based on your Figure 5 data, ask yourself: Using the average, could a qualified academic offer their HE services, not as an institutional employee, but as a member of a profession – as lawyers, doctors, psychiatrists, and others offer their services, which are of equal social and personal value? As your data indicates, the government revenue source alone would provide T and T-T faculty in professional private practice with an annual gross income of $400,000.
As Anne suggests in the comments, the faculty denominator is larger when contract employees are added. As you have lamented, Stats Can shamefully neglects this portion of the academic labour in HE, which for the Humanities and Social Sciences stands at 56% and 50%, respectively in 2018-19 (DOCUMENT TITLE (policyalternatives.ca). Using 2018-19 data and a headcount measure that includes part- and full-time contract faculty, I estimate that the figure is $265,038/annum.
This change in denominator sheds light on the PSA professional service model, which can be used to supplant or supplement the existing institutional model. I would appreciate your thoughts on such a possibility.