


Over the summer, Statistics Canada did a data dump on student debt from the 2015 National Graduate Survey. I haven’t really had a chance to dive into it until now, but here’s a quick round-up.
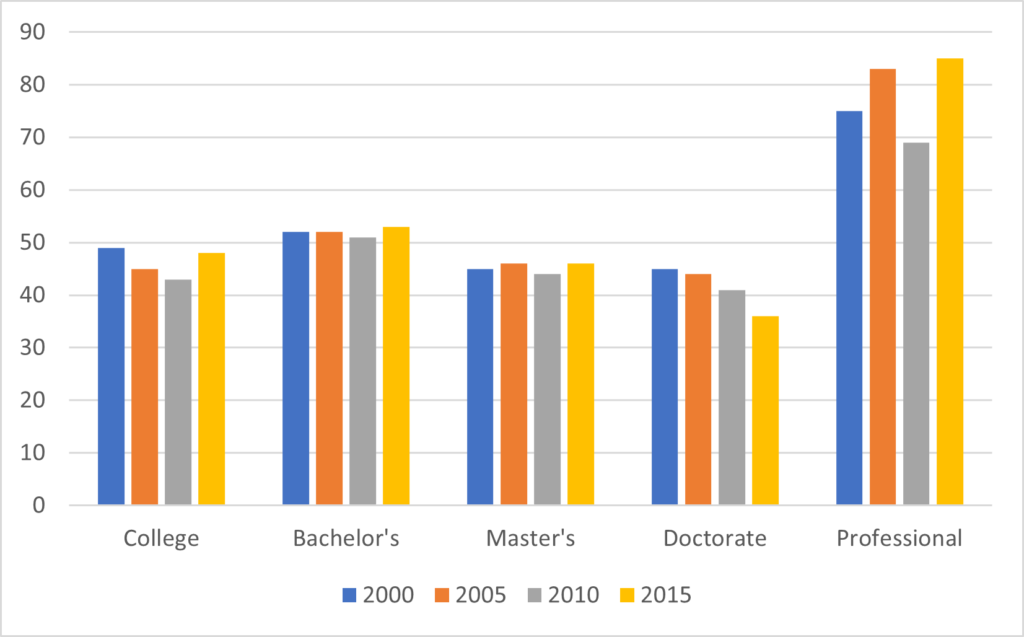
Let’s start with the proportion of students who are borrowing (see Figure 1). Rates of borrowing vary quite a bit by level of education: lowest at the doctoral level and highest in professional programs such as law and medicine. Neither is surprising: professional programs have high tuition fees, and doctoral students tend to receive support packages. What is a bit more puzzling is that the rates of borrowing seem to be going in different directions at different levels of education, though it’s possible that some of the volatility for doctoral and professional levels are due to smaller sample sizes. But overall, this picture suggests that for the vast majority of Canadian students (i.e. those studying in College or Bachelor’s programs), borrowing rates in 2015 were more or less unchanged from the turn of the century.
Figure 1: Percent of Graduating Students with Student Debt, by Level of Education, Canada, 2000-2015
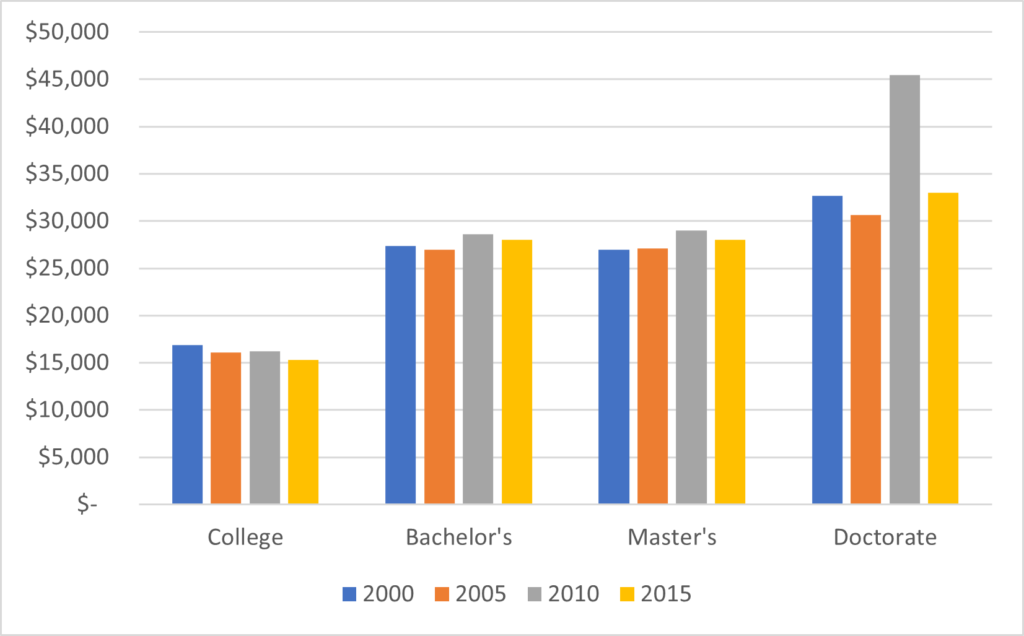
In Figure 2, we look at total indebtedness at time of graduation for those with debt (i.e. excluding the half of the student body with no debt), with all figures adjusted to be in constant 2015 dollars. Although one often hears about “skyrocketing student debt,” it turns out that the average amounts of indebtedness, from both public and private sources, are either stable or declining over time (we can probably dismiss the 2010 result for doctoral students as an outlier; and no, I don’t know why Statscan doesn’t break out debt for graduates of professional program).
Figure 2: Average Total Student Debt by Level of Education, Canada, 2000-2015
Now wait a minute, some of you may be saying (because it is remarkable how few people are willing to believe that students are not endlessly put-upon). This is data from 2015! Maybe it has skyrocketed since then? That’s a worthwhile question to ask, but before I answer it, let’s take a quick look at the distribution of student debt across the country. Figure 3 provides average debt by province which – as you can see – varies quite a bit at the bachelor’s level (less so at the college level). Quebec has low indebtedness, not only because tuition is low, but also because grant thresholds are low, and degrees on average are shorter. Debt is higher on average in the Maritime provinces, where family incomes are lower and grant programs are less generous. Everywhere else, undergraduate debt is pretty close to $30,000.
Figure 3: Average Total Student Debt at Graduation, by Province and Level of Education, 2015

Now, back to that question about whether debt is going up or down since 2015. Let’s start by recognizing that “average debt at graduation” is a function of average annual borrowing over the 3-4 years prior to graduation. So, debt in 2015 is really a reflection of aid policies between 2011-15 and debt for the class of 2020 will be a function of those in place between 2016-20. Also recognize that the national debt number is mostly a function of the Ontario number, since Ontario represents about 50% of all student borrowing nationally.
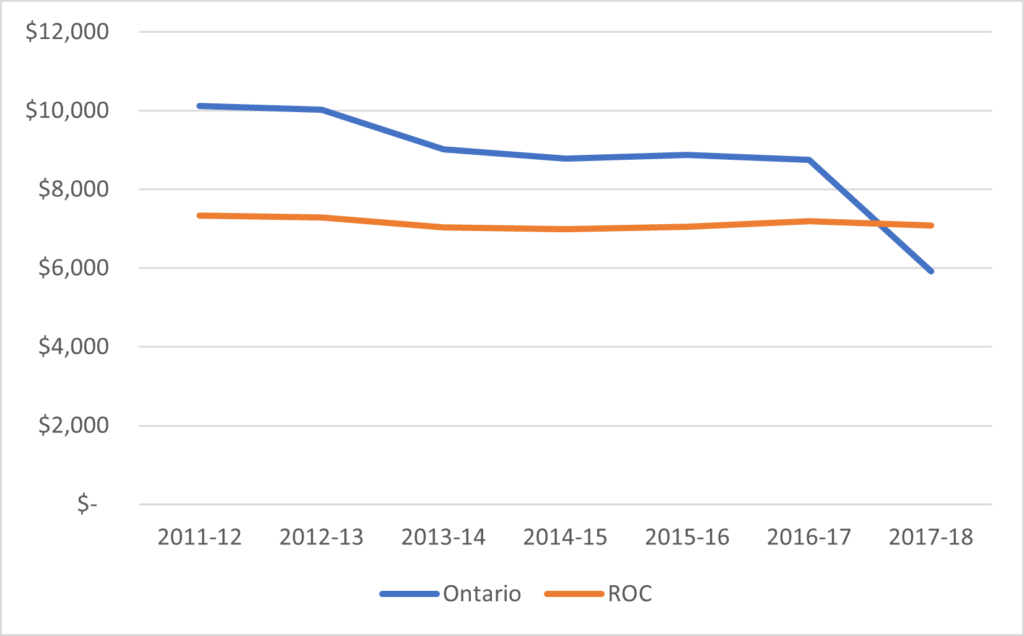
Now, let’s take a look at average loans over the past few years across the country, as we do in Figure 4 below (note: this data was gathered by HESA over the summer through a series of Access to Information requests). That dip in borrowing in Ontario in 2017-18 is the start of the former government’s targeted free tuition program. It lowered average borrowing in the province by $3,000, lowering the national figure by about $1,500. This program lasted for two years (17-18 and 18-19) before the Ford government eliminated it, at which point average borrowing likely rebounded back to around where it was in 16-17 or perhaps just a bit higher. Now, without detailed data from other provinces, it’s impossible to say for sure if there were off-setting trends elsewhere in the country, but it seems unlikely given what we know of federal and provincial loan programs (none of which changed significantly after 2017-18).
Figure 4: Average Loan per Borrower, Ontario and Rest of Canada, 2011-12 to 2017-18
So the balance of probability is that average debt nationally in 2020 was a couple of thousand dollars lower than it was in 2015 thanks to the Ontario student aid program, though in fact across most of the country debt levels were likely more or less unchanged.
But however you slice it, debt is not rising, let alone “skyrocketing”. Anyone who tries to sell you a story like that needs to be regarded with suspicion.

