


For some time now, Statistics Canada has been working on at least partially superseding the National Graduates Survey (NGS) with something much better – a direct link between school-record and tax data, allowing for a more thorough and complete examination of trends in education and the labour market.
For context: the NGS dates to 1982 (though it had a forerunner in 1976). It’s a survey which was originally delivered to the graduating classes of 1982, 1986, 1990, 1995, 2000, 2005 and 2010 (there’s another one in process for the class of 2015). The sample sizes were pretty good – 50,000 or so at all levels of PSE, which meant one could get reasonably good data for every province. They were initially delivered two years after graduation (that is the class of 1982 was interviewed in 1984, the class of 2000 in 2002, etc.) and until 2005 there was also a five-year follow-up survey. Or at least that was the case until the 2010 cohort when Statscan decided to move the sample frame from two years out to three years out, thus murdering a perfectly good 30-year time series for no very good reason whatsoever.
For the most part, NGS was used to look at questions concerning post-graduation income, student debt, and issues in student loan repayment. Other topics it covered tended to get less attention. So, it has been plain for a long time that it would be a lot more efficient if, instead of doing expensive surveys every few years, you could just make an administrative link between the student record of every graduating student (which Statscan already has through the Post-Secondary Student Information System, or PSIS) and link it to tax data (either the LAD or the T1 Family File). That way, we could get exact data on earnings every year, with no lengthy time lags and no survey costs. If we could then also link this to data on student loans and grants (which would require provincial co-operation), we could more or less get rid of NGS altogether.
So, that’s not happening exactly – we’re still getting an NGS survey, and it’s still asking questions about student aid and it is still (for some totally incomprehensible reason) being done three years out – but Statscan has created something called the Education and Labour Market Longitudinal Platform by linking PSIS and the T1FF. They recently released its first data from this. It’s not particularly exciting data – median income by level and field 2 years out for every cohort from 2010 to 2014 and 2- and 5- year income levels for the 2011 cohort – but a) it does suggest there is the potential for a lot more data to come from this source, which is good news and b) publishing the data at two years out partially undoes the time-series atrocity Statscan committed with the 2010 cohort, which is excellent news.
Here, I want to place some of that data into a longer-term context, specifically by looking at the 2010 and 2014 data on graduate earnings two years out along with longer-term data on earnings from previous NGS surveys. Now I know this isn’t entirely kosher because of the difference in data collection methods (survey vs. admin data), but let’s give it a shot anyway. In the figure below, the years on the X-axis represent the year in which the cohort graduated: the actual value ascribed to it is the median income of that cohort 2 years later (so, the value for 2014 is the 2016 earnings of the class of 2014).
Median Graduate Earnings 2 Years After Graduation, by graduating cohort and credential, in 2016 Constant Dollars, 1986 to 2014
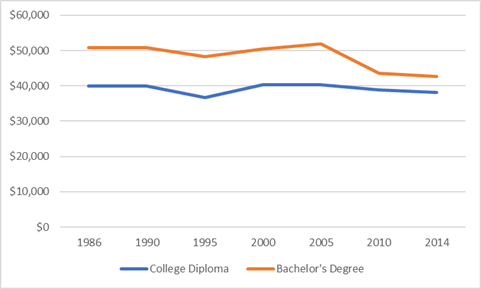
Now, caution because of the series break at 2010, but I think this shows that bachelor’s degree earnings fell by about 15% between 2005 and 2010 while college earnings remained more or less unchanged. It’s hard to see how that can be entirely a data collection issue (why would it affect the results for bachelor’s degree and not for college diplomas?).
It’s tempting, of course, to blame this all on the 2008 financial crisis and it’s just a short hop from there to “everything is different now/4th industrial revolution/whatever other malarkey you have on offer”. But I think it’s worth remembering that the 2000s were also a period of enormous expansion in the system. Between 1998 and 2015, the number of undergraduate degrees awarded annually jumped by 50% (from 124,000 per year to 186,000 per year) while the labour force as a whole only grew 25%. The fastest part of that expansion happened between 2005 and 2007, when the number of graduates shot up from 149,000 to 173,000 – mostly the effect of the double-cohort in Ontario – which suggests that an increase in supply is at least as plausible an explanation as a deeper change in the economy.
Anyways, as I say this data isn’t stunning – it confirms a lot of other observations we’ve had over the past few years. But it is the start of much more regular and timely graduate data from Statscan (and hopefully more granular as well), and that’s very welcome.

