


I got a lot of feedback on last week’s blog about provincial PSE spending comparisons. So much so that a few of you asked for a bunch of other comparisons. This blog does nothing but aim to please, so let’s get to it.
One question I received a couple of times was “what happens if you throw student assistance expenditures into the mix”? This is a good question. In particular, Ontario – which as you will recall came dead last in all of last weeks’ comparisons – spends a lot on student aid, and if that funding were included, it might make a difference. But does it?
In a word, no, as Figure 1 demonstrates.
Figure 1: Provincial Expenditures via Transfers to PSE Institutions and Student Aid per FTE student, 2015-16
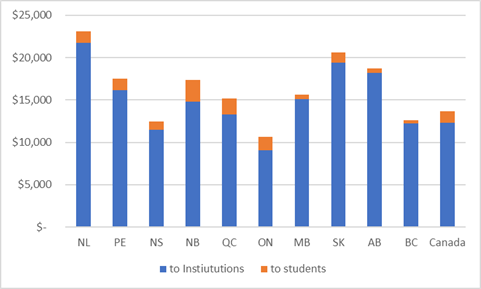
So, the data on institutional expenditure is from Statistics Canada, and the data on student aid is from the annual survey of provincial budgets we do here at HESA Towers. Nationally, the amount provincial governments spend on student aid is only about $1,350 per FTE student, which is less than an eighth of the $12,306 per FTE they spend on institutions. Now that varies substantially: British Columbia is, by some distance, the lowest at $369 per student, and New Brunswick the highest at $2,570 per student. That number is inflated because New Brunswick includes its graduate tax credits in the student aid figures, whereas tax credits elsewhere do not. If you ignore New Brunswick, Quebec is the top spender at $1,901 per student, though improvements in aid in Ontario since 2015-2016 would probably put that province in top spot at around $2600 per FTE. Regardless, though, the differences are nowhere near big enough to actually change positions.
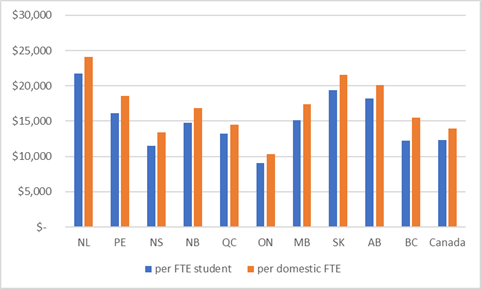
Another reader (hi, Jim!) asked me to try looking at this from another perspective: not funding per student, but funding per domestic student. Fair enough. Check out figure 2. Basically, this approach shifts everything upwards a bit, but as with student aid, not enough to change the rank order.
Figure 2: Provincial Transfers to PSE Institutions per Domestic FTE Student, 2015-16
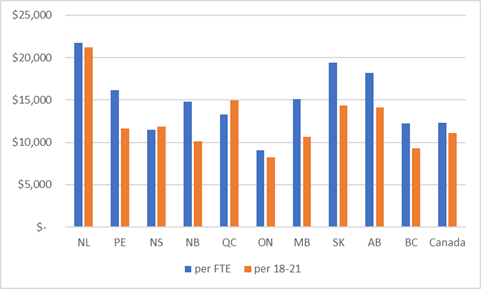
Another reader (hi, Arthur!) suggested per student was the wrong measure because it made provinces with low participation rates or high net-outmigration rates look unreasonably good. What if, instead, the data was portrayed in terms of expenditures per 18-21 year olds? Again, another fair point. As figure 3 shows, this changes things quite a bit. PEI, New Brunswick and the four western provinces all look a lot worse on this measure. In fact, British Columbia looks so much worse that is approaching Ontario levels (still the standard as far as being rock-bottom is concerned).
Figure 3: Provincial Transfers to PSE Institutions per Resident aged 18-21
Putting the first and third of these together, we find maybe the only way to make Ontario not the worst province in the country: transfers to institutions PLUS student aid, per resident aged 18-21.
Figure 4: Provincial Expenditures via Transfers to PSE Institutions and Student Aid per resident 18-21, 2015-16
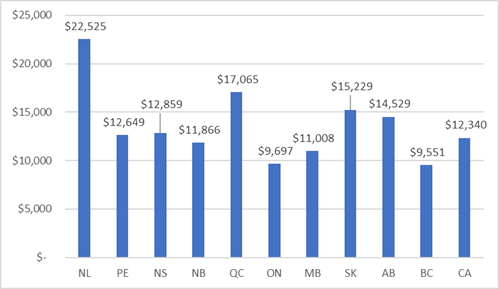
(All the usual caveats about Newfoundland and Saskatchewan no longer looking quite so good after a couple of years of drastic cuts. But you knew that)
Anyways, the point of all this remains: relative performance in post-secondary education is to a large degree a function of what lens one chooses to use.

