


Just for fun, I went prowling through some back issues of OECD’s Education at a Glance (as one does), to look up how public financing of tertiary education has changed over time. OECD specifically says you shouldn’t do this, which I see as an admission that they view the data submitted by national governments as either not particularly reliable or at least compiled by different people using different definitions/standards on an annual basis. Having looked over the data, I can see why, but I think in most countries – the UK being the huge exception – it is relatively reliable and therefore usable. South Korea and Canada have some question marks, which I will get to at the end.
Here’s what I found: If you just compare total spending on post-secondary institutions in 1999 and 2020 across ten major OECD Countries (Australia, Canada, France, Germany, Italy, Japan, Korea, Netherlands, Sweden and the US – as noted, I am excluding the UK because its data is too wacky), what you find is that expenditures are up in seven of the countries and down in just three – Korea, Sweden and Canada (but again, stick around to the end for more on this).
Figure 1: Total Expenditures on Tertiary Institutions as a Percentage of GDP, Selected OECD Countries, 1999 vs. 2020

Now, let’s focus on public spending. Here the ten countries are evenly split in terms of public spending on tertiary education as a percentage of GDP: five countries have seen increases and five have seen decreases. Canada is one of the ones with decreases but note that its level of public funding remains tied for second-highest (with the Netherlands) in this group of countries in 2020.
Figure 2: Total Public Expenditures on Tertiary Institutions as a Percentage of GDP, Selected OECD Countries, 1999 vs. 2020

Now, one might look at figure 2 and say, ah, well look at those Europeans, they’re putting more public money in! Good for them, no pasaran on privatization, etc. Except…look at the European countries (figure 3). When it comes to the proportion of total funding coming from the public sector, in every single case it is heading downwards, in some cases quickly. On the other hand, outside Europe (figure 4), apart from Australia, what we see is much more stability in terms of the percentage of money coming from the public sector. In fact, since 2004, no country has seen less decline in public financing as a percentage of total funding than the US (yes Korea, but again, wait until the end)
Figure 3: Percentage of Total Expenditures on Institutional Institutions Coming from Public Sources, Selected European OECD Countries, 1999 vs. 2020

Figure 4: Percentage of Total Expenditures on Institutional Institutions Coming from Public Sources, Selected Non-European OECD Countries, 1999 vs. 2020

Y’all know where this is going next: private funding as a percentage of funding. Here we see that this has increased in 8 countries, with the only two exceptions being South Korea and Canada. Clearly, there is something wonky about the Canadian data, but it is at least internally consistent – according to the data OECD is using, the percentage coming from private sources has gone up, but the is more than offset by the fact that total institutional revenues have declined as a percentage of GDP.
Figure 5: Total Private Expenditures on Tertiary Institutions as a Percentage of GDP, Selected OECD Countries, 1999 vs. 2020

Time now to interrogate some of this data, or at least those for the two big outlier countries, South Korea and Canada. Let’s start with the former. Remember how its proportion of public financing rose? Well, what’s actually happened is a collapse of private financing for tertiary education – one so big that, if you believe the data in figure 6, is probably the biggest drop in peacetime education expenditures anywhere in the world.
Figure 6: Total Expenditures on Tertiary Institutions by Source as a Percentage of GDP, South Korea, 1999 to 2020
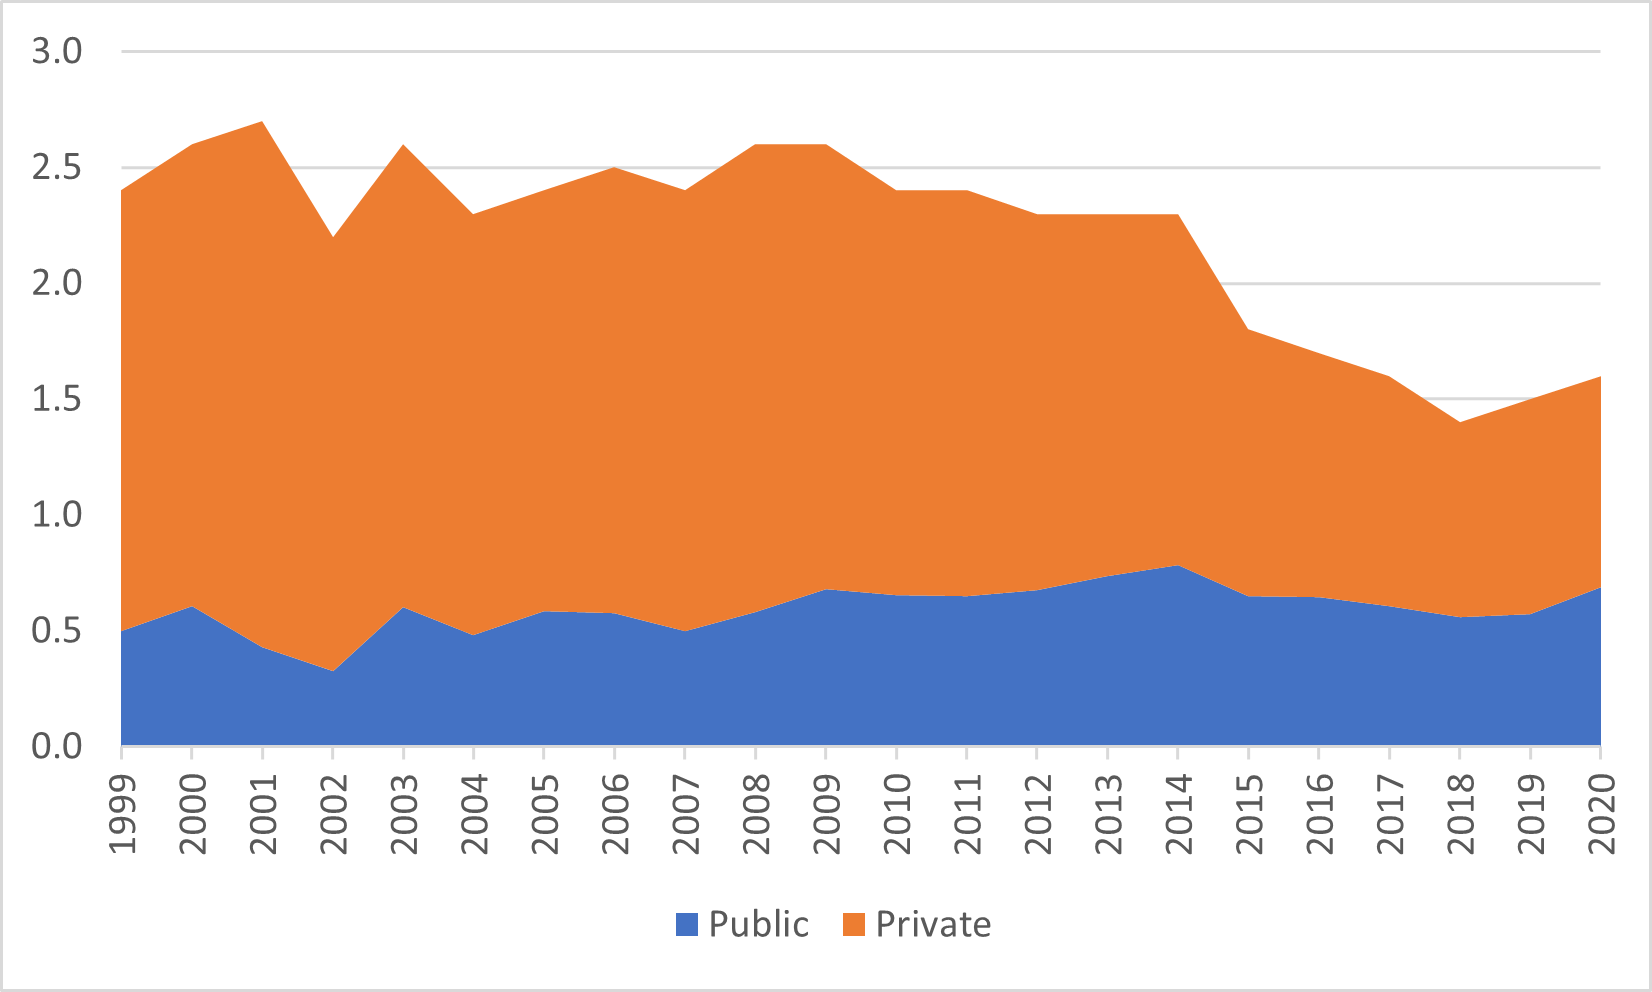
What’s going on here? There are three answers. The first is that total enrolments are down 10-15% from where they were in about 2013, mainly because of a truly challenging demographic pyramid. The second is that tuition has been frozen in Korea since 2012, and the third is that Gross Domestic Product grew by about 15% in real terms between 2013 and 2019 which – taken together, mean that the real value of private tuition will have fallen substantially. It’s not at all clear though all that accounts for a fall of 50% in GDP terms for private expenditures on post-secondary education. A change in methodology, perhaps? Hard to say, though the precipitous drop in 2014 suggests that’s probably part of the story.
Now, Canada. As y’all know, I follow Statscan’s reports on public financing closely and I can tell you for certain that while the data it currently reports to the OECD is reasonably close to what it is currently reports in the FIUC and FINCOL surveys, that wasn’t the case 20 years ago. Back then, Stastcan was reporting to OECD that private funding of post-secondary education was 1% of GDP but reporting domestically that it was 0.6%; it was also describing a system where overall expenditures on PSE were about 2.5% of GDP rather than 2.0%. As a result, the OECD data shows a decline in private spending over 20 years when in fact there has been a significant increase.
Figure 7: Total Expenditures on Tertiary Institutions by Source as a Percentage of GDP, Canada, OECD data vs FIUC/FINCOL compared, 1999 to 2020
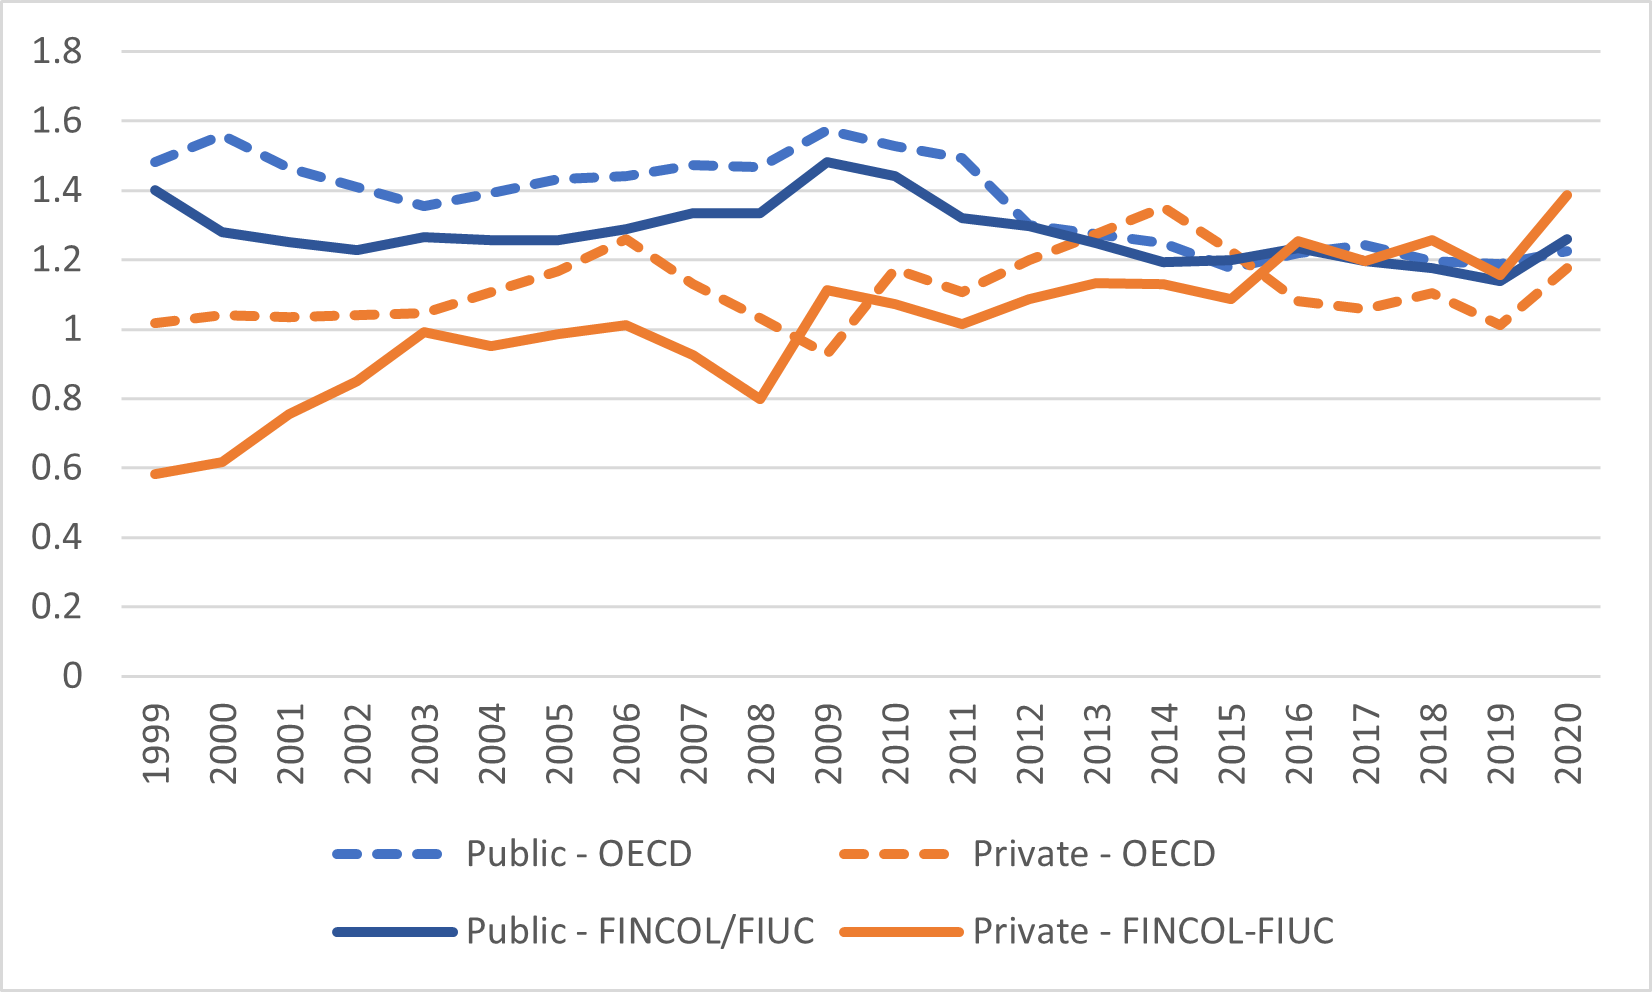
I am not saying one data source is right and the other one is wrong, and there are always going to be some definitional quirks which prevent numbers from lining up exactly, but I’d sure like to know how Statscan seems to have reported an extra amount equivalent to $4 billion in private financing/tuition dollars in the late 90s/early 2000s when reporting to OECD.
In any event, point being: Canada is not really the outlier it appears in figures 4 and 5: we too, had a big jump in private financing, kind of the way every other country in the OECD which wasn’t facing a disastrous population decline did.

