


Every three years the Canadian University Survey Consortium publishes a report on first-year students in Canada, and since their new report dropped a few weeks ago (available here), I thought it would be a good time to see what’s changed over the last few years.
Quick recap on the CUSC survey: though the questions are mostly the same from year to year (or at least the ones I tend to examine are), the consortium membership changes from year-to-year, so comparisons over time are never quite apples-to-apples. It has never had great participation from Quebec, and over time the membership has shifted towards smaller institutions. But given that neither StatsCan nor ESDC seem to have any interest in paying for a genuine national student survey (the last one was in 2008), this is the best we have. If you keep the above caveats in mind, it’s a pretty useful instrument.
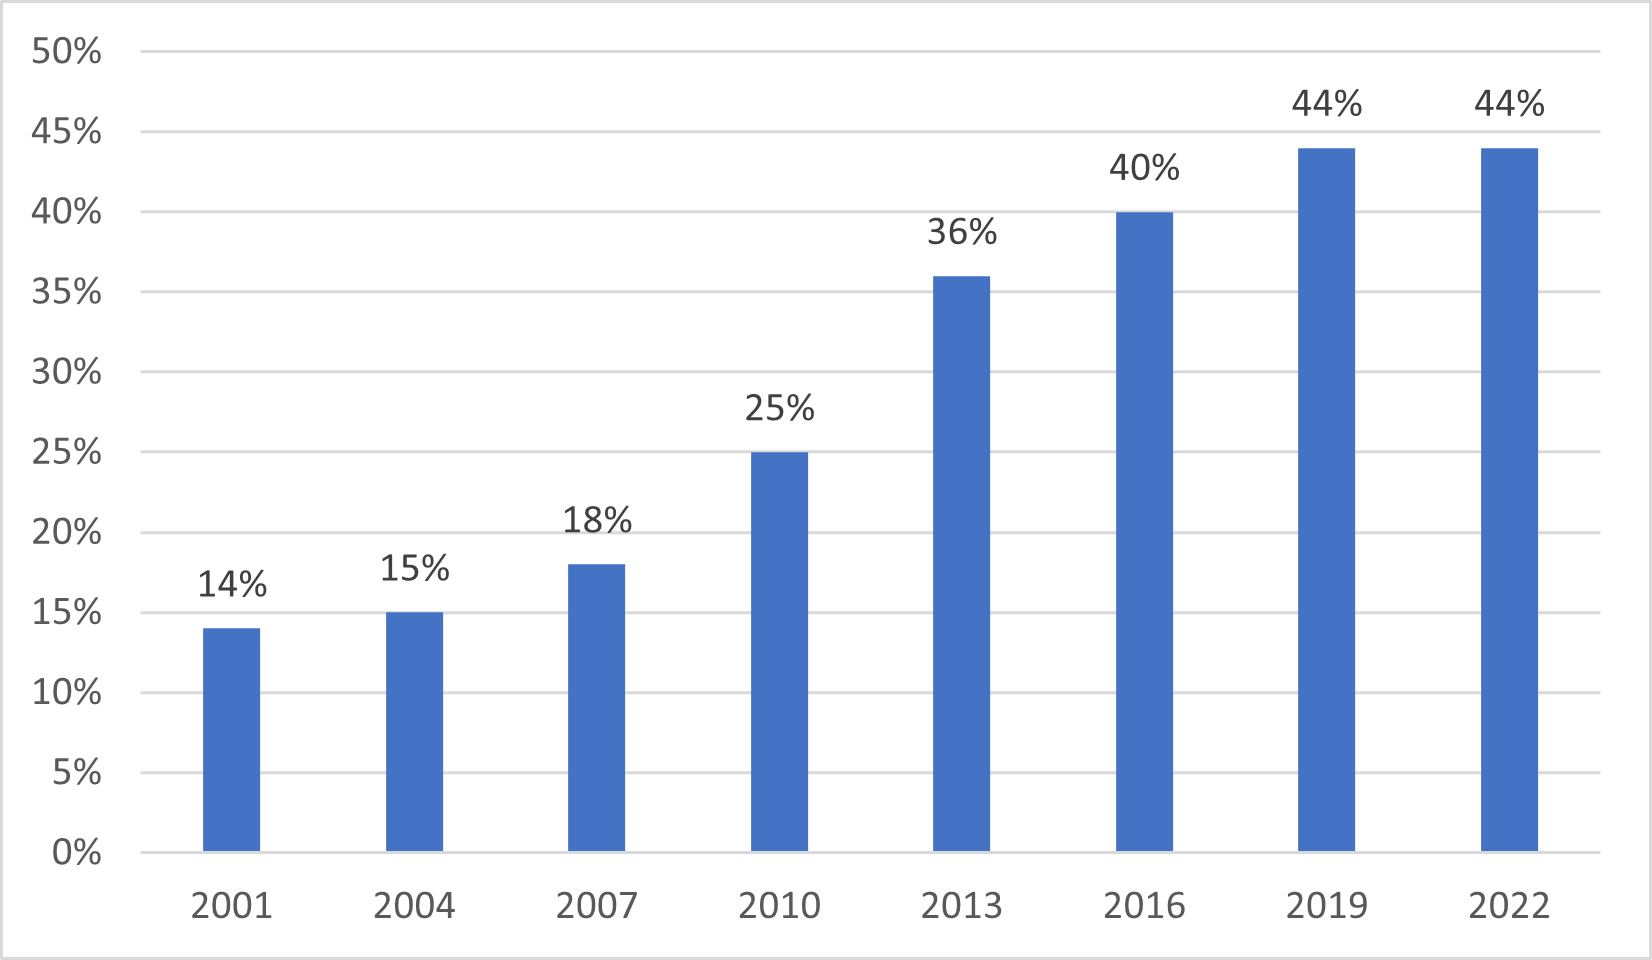
Let’s start with some demographic information. In both the 2019 and 2022 surveys, 44% described themselves as being a “visible minority”, more than triple the proportion who did in 2001. Even if we exclude all those who also indicate that they are international students – not all of whom are visible minorities – the 2022 figure is still 30% (the 2019 figure was an even higher 35%). Partly, this change reflects the country’s changing ethnic composition, but it also reflects the fact that visible minorities are more likely to go to school than other Canadians. Consider that among Canadians aged 15-24 at the time of the 2016 census, only 27% indicated they identified as a visible minority; with somewhere between 35-44% of domestic students claiming the same, that suggests an over representation of between 30-60%. Internationally, this is rare: normally, minority populations are much less likely to attend university than the “visible majority”.
Figure 1: First-Year Students by Visible-Minority Status, 2001-2022
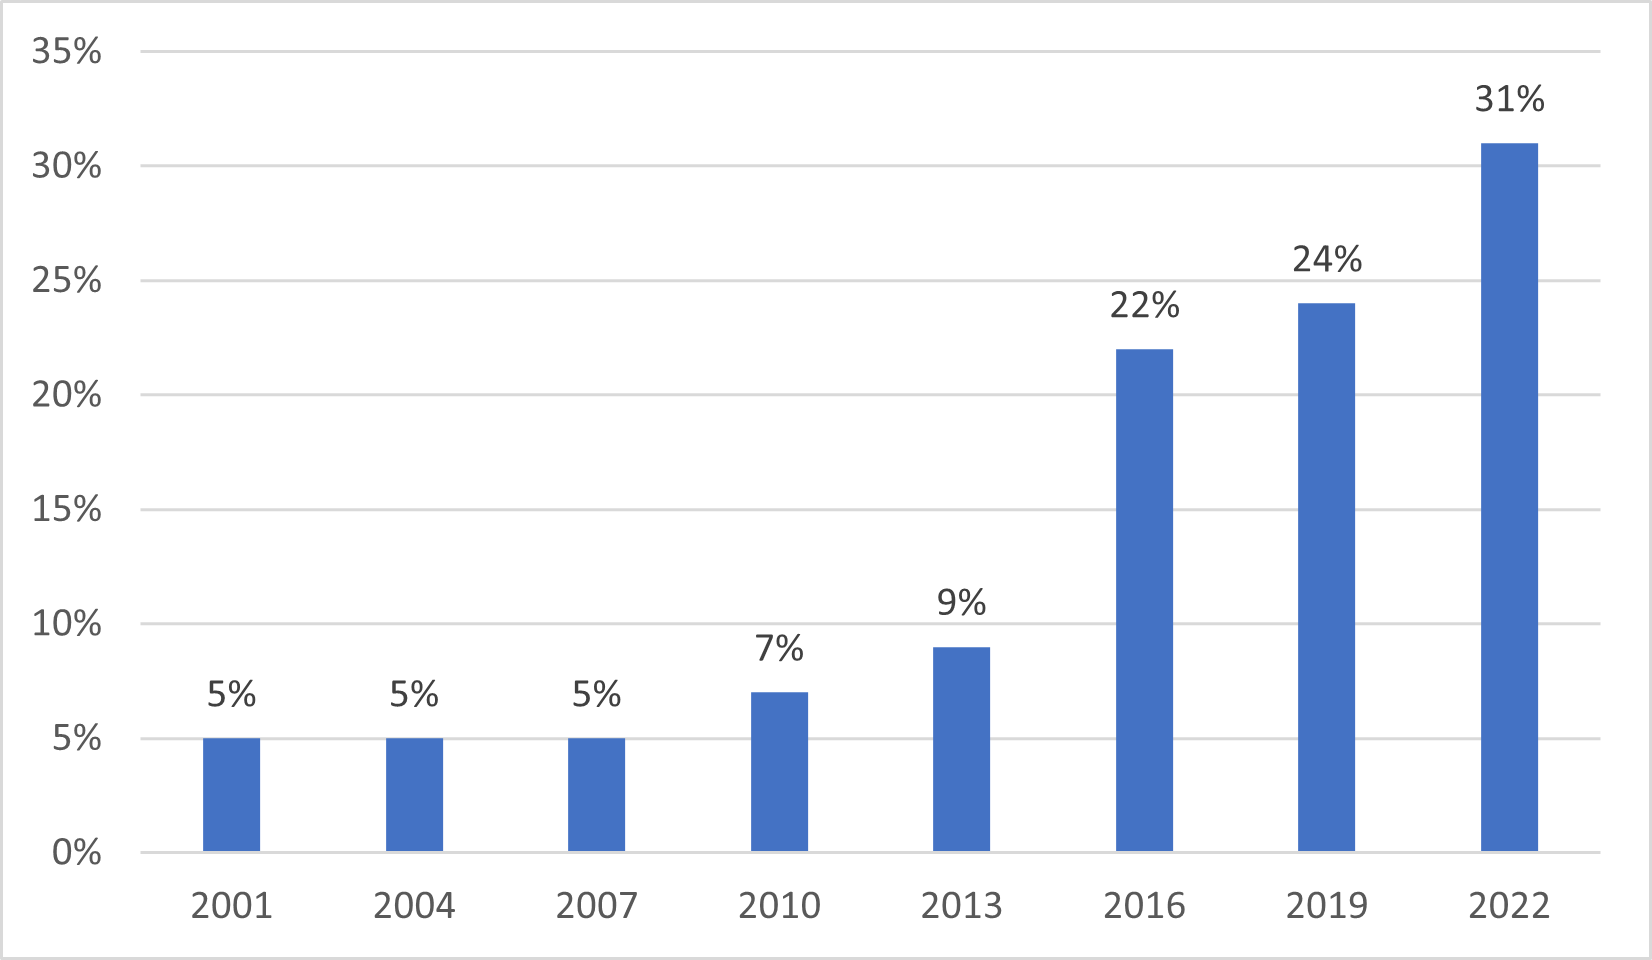
Another significant shift over time is in the proportion of students who self-report having a disability/impairment. Between 2001 and 2013 this figure crept up from 5 to 9% — whether because more students with disabilities were accessing education or because of a reduced stigma in disclosing disabilities (or both) is impossible to determine. In 2016, the wording of this question changed to explicitly include mental health issues and the proportion of self-reporting students shot up to 22% and by 2022 had reached 31%. Two-thirds these students in 2022 indicated that they had a mental health issue (up from about half in 2019).
Figure 2: First-Year Students Reporting Disability, 2001-2022
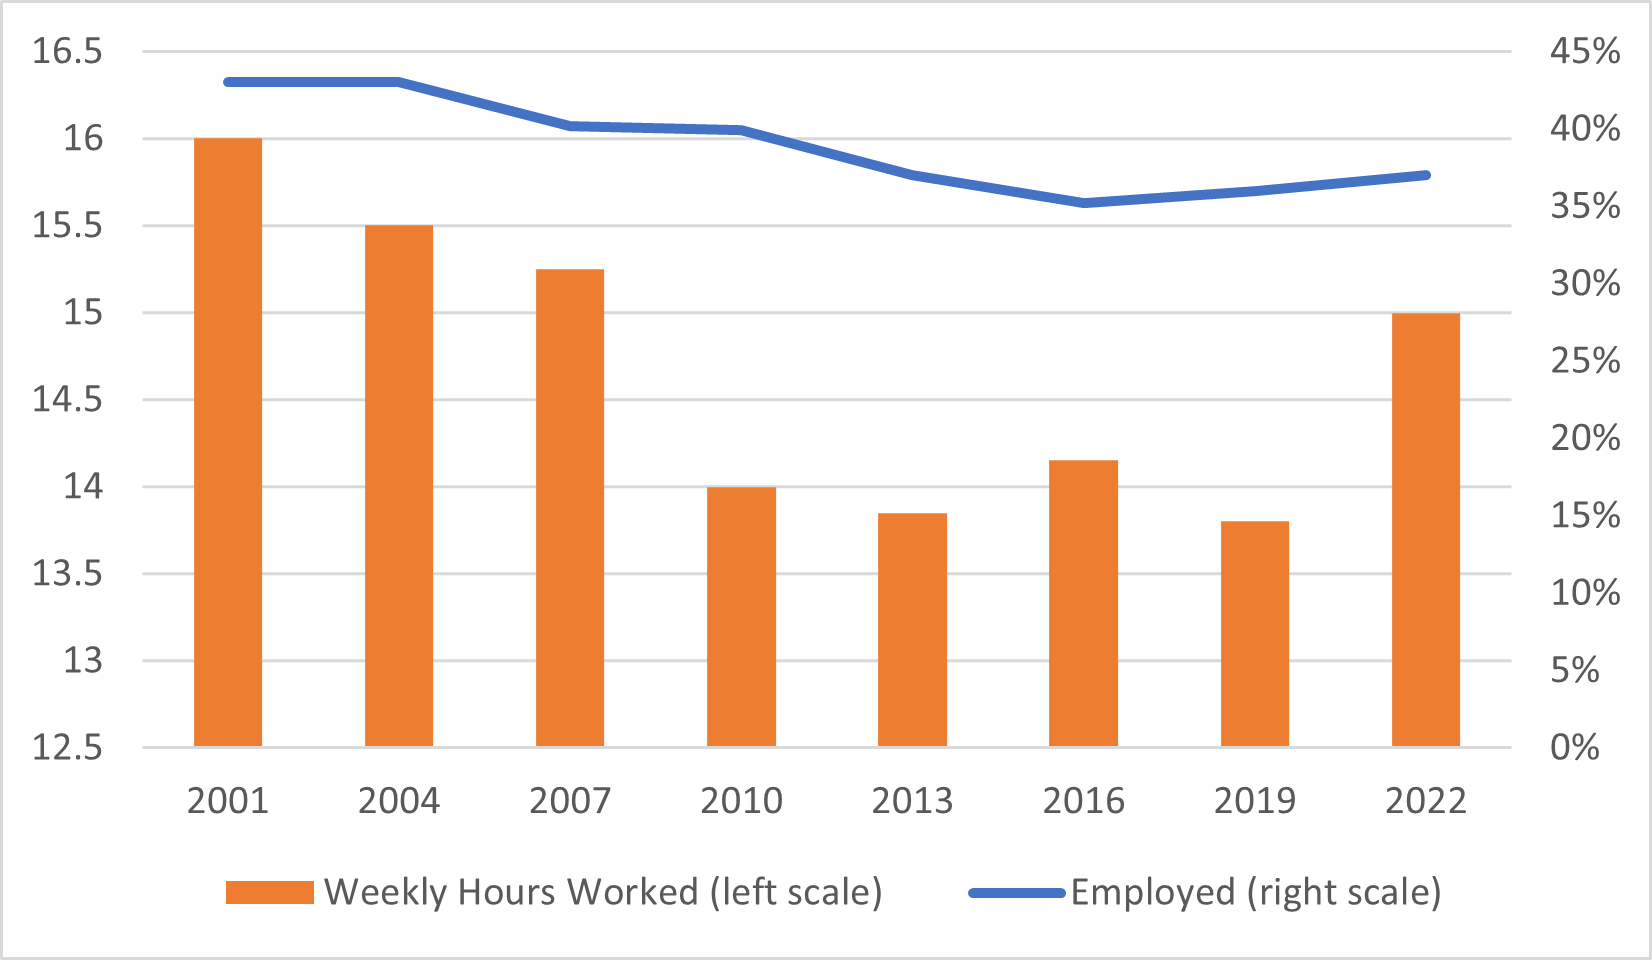
Another interesting axis of comparison has to do with student employment. For many years, both the incidence of work (that is the percentage employed) and the hours of work were slowly declining. In this year’s survey we see the biggest uptick in work in twenty years, both in terms of incidence and hours. It is not clear exactly what is causing this (my guess: students are belatedly reacting to lower student loan claw backs on earned income), and of course one data point does not a trend make, but this is something worth keeping an eye on.
Figure 3: First-Year Students Employment Rate and Average Hours of Work, 2001-2022
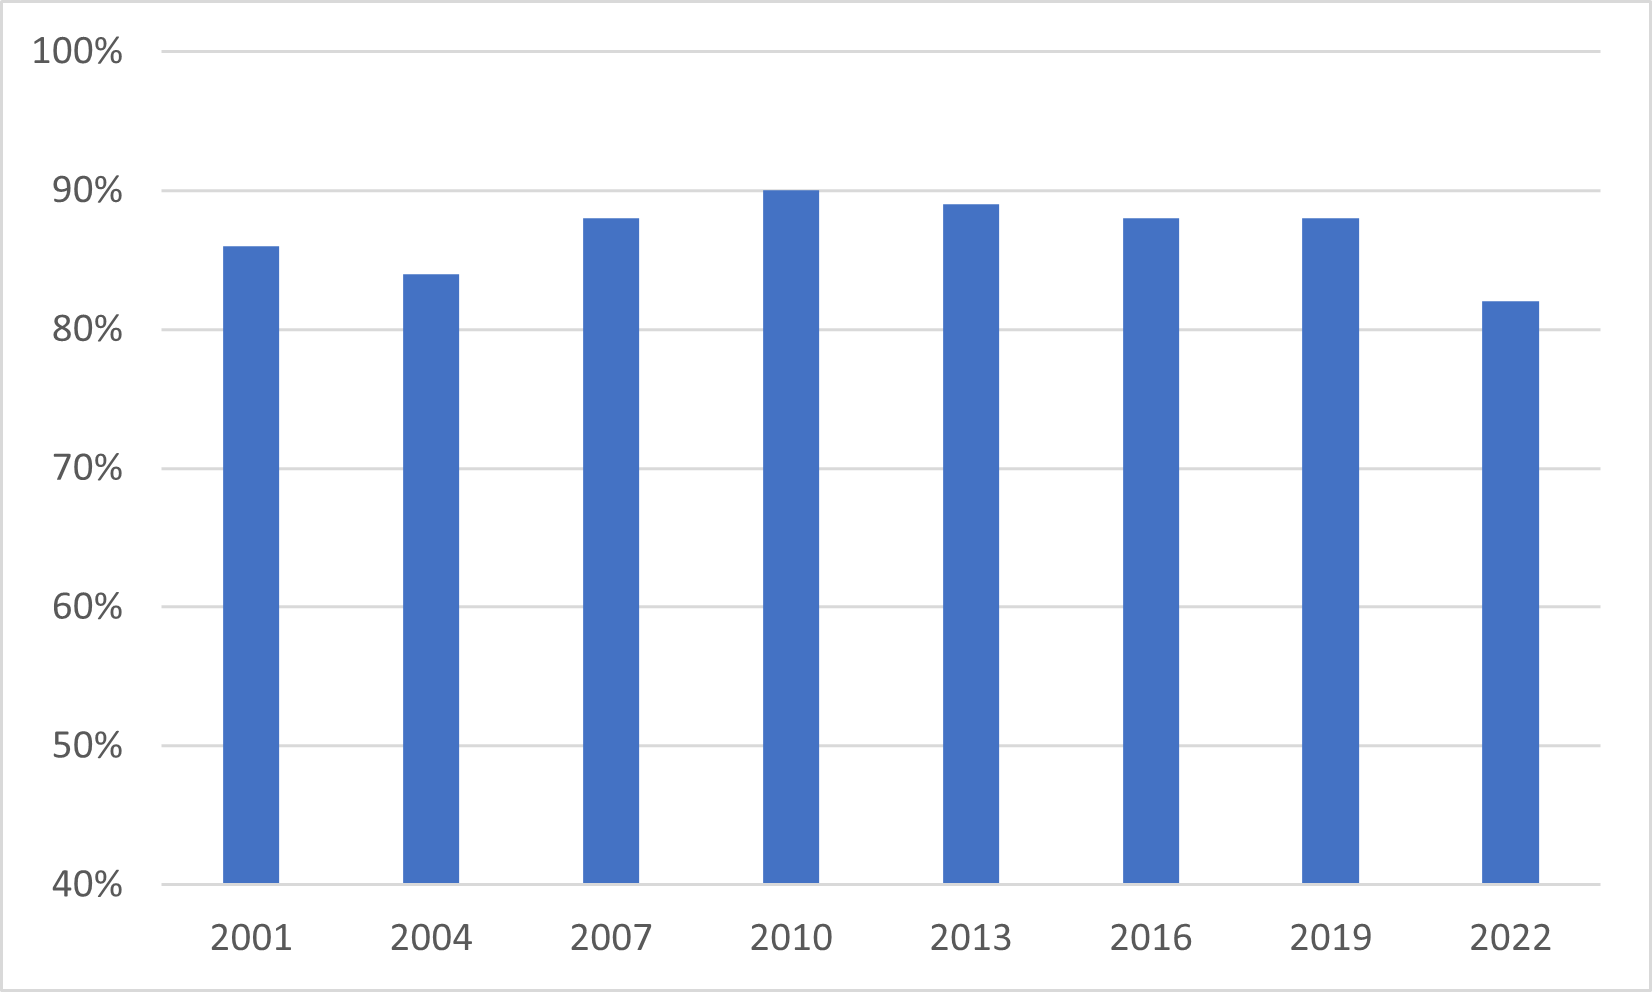
Finally, let’s look at what first-year students think about teaching quality. One might expect that given the significant increase in the ratio of students to full-time faculty over the past couple of decades that one might see some deterioration in the percentage of students saying they agree or strongly agree with the statement “I am satisfied with the quality of teaching I have received”. But in fact, in most years the figure bounces around between 85 and 90%. Last year, though, was an exception, and only 82% said yes. My guess is that this is probably connected with the fact that 70% of them also reporting having had one or more classes on Zoom last year, but I guess we’ll see what the numbers look like in 2025.
Figure 4: Percentage of First-Year Students Saying They Agree or Strongly Agree With the Statement “I am Satisfied With the Quality of Teaching I Have received”, 2001-22
Many thanks to the CUSC members for doing these surveys and making the results public. More institutions should participate (especially from the U15!): it’s cheap and the country needs quality national data sets, particularly where students are concerned.

