


I recently published some time series data on student debt in Canada, to wit:
Figure 1: Average Student Debt at Graduation, Various Sources in constant $2021, Canada, 1982-2021
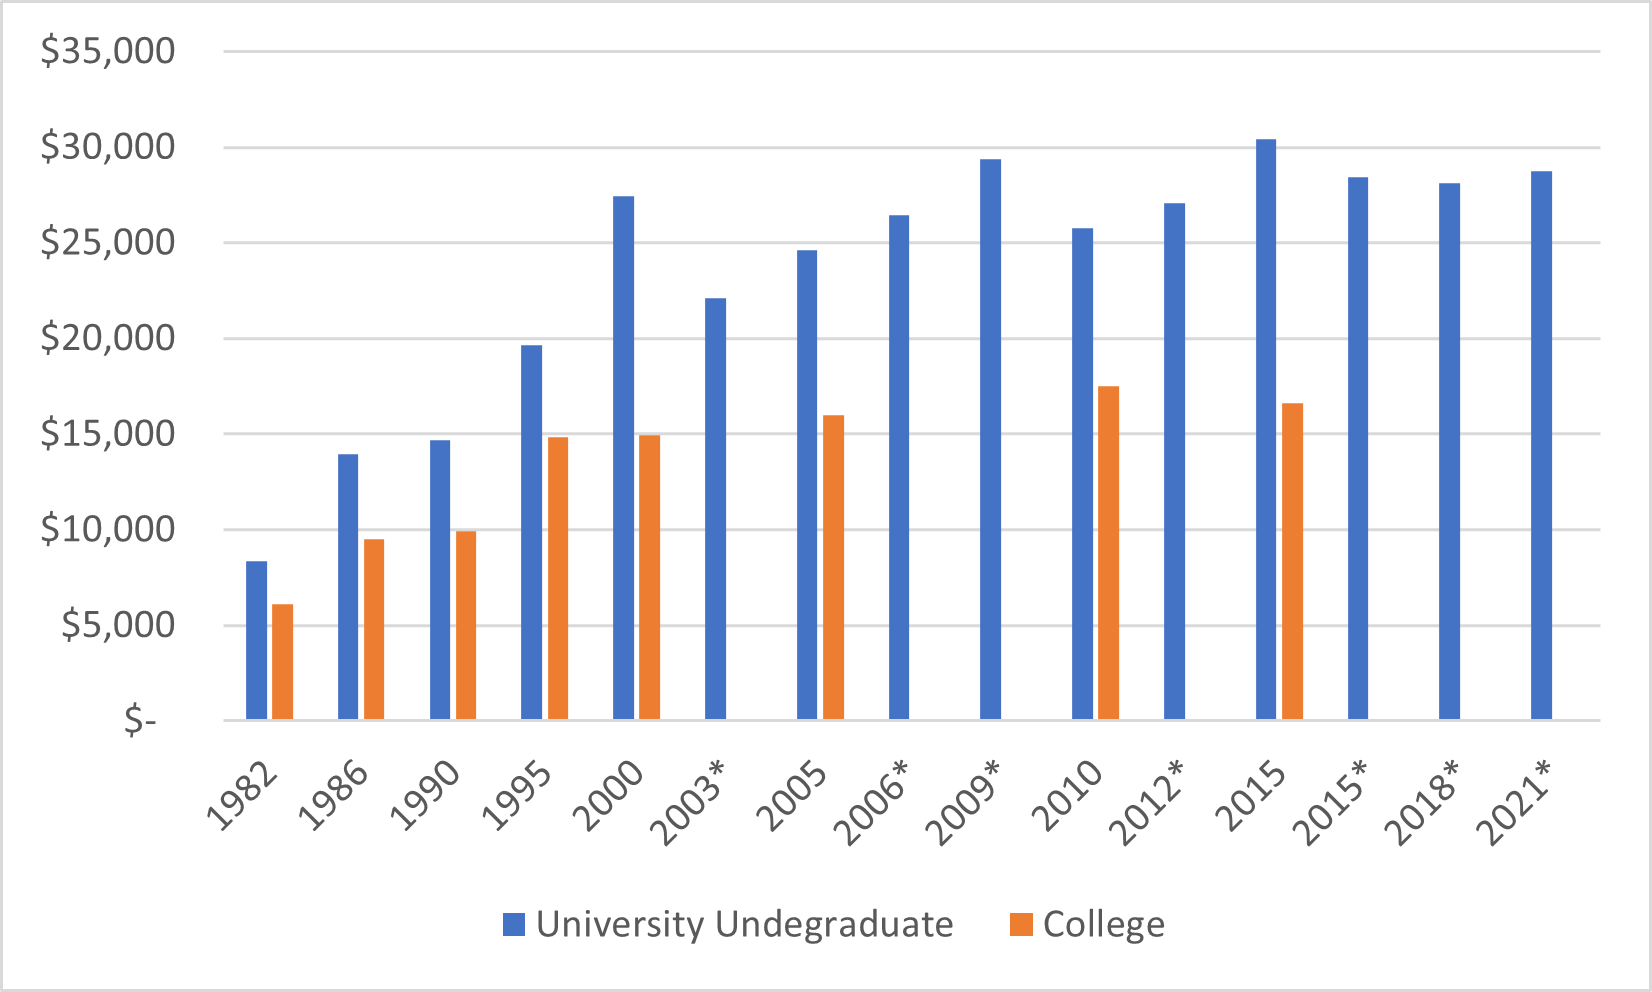
*indicates data from the Canada University Consortium; otherwise data is from the National Graduates’ Survey
As is often the case, national figures obscure provincial differences. So today I wanted to put some data out there to provide those nuanced regional figures.
Let’s start with the issue of annual borrowing. In Figures 2 and 3, I show average annual net borrowing across all ten provinces plus the national average, in constant $2019 dollars. I calculate this by taking total borrowing, subtracting the amount of loan forgiveness (not much of a thing anymore, but something governments used to spend upwards of $500M/year on), and then dividing the difference by the number of borrowers in that year. This last number is probably slightly low in all cases: while it is possible to obtain the number of annual borrowers under both provincial loan programs and the federal program, the two numbers are never the same for a variety of reasons. In general, the provincial numbers are higher in western Canada and the federal ones are higher in eastern Canada. In the absence of any combined numbers, I take the higher figure of the two.
Figure 2: Average Annual Public Student Loan Borrowing, in $2019 Constant Dollars, Canada and Four Largest Provinces, 1993-94 to 2019-20
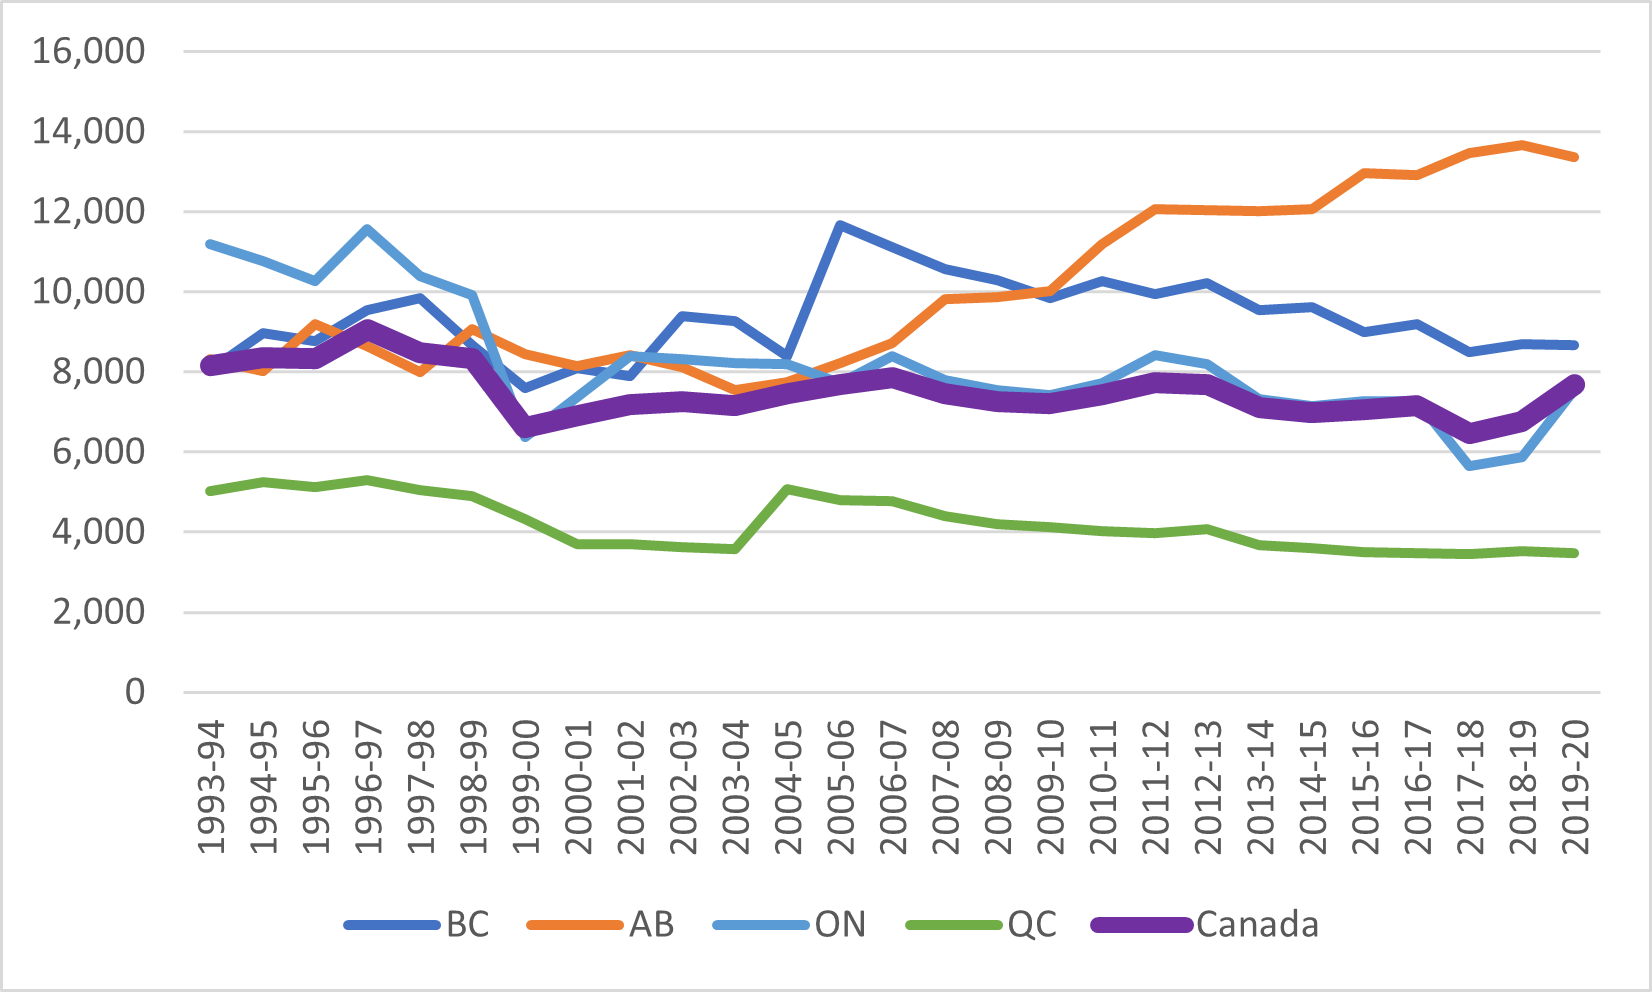
Figure 3: Average Annual Public Student Loan Borrowing, in $2019 Constant Dollars, Six Smaller Provinces, 1993-94 to 2019-20

(If you’re wondering about the source for this data, I’ve been doing surveys of provinces for quite some time and now do annual FOI requests to get what I need. It’s a kind of bespoke data base).
Now, the question is how this translates into actual debt. This is a problem because I haven’t asked this question and provinces don’t publish it. Annual average borrowing probably differs somewhat between students in universities, colleges and private career colleges. At a provincial level, the mix of students between those three types of students varies a bit from one jurisdiction to another. And the average number of years of borrowing therefore probably varies a bit as well. So just because we know annual borrowing levels doesn’t mean we know what average debt is for undergraduate or college students.
But that doesn’t mean we can’t do some extremely fun back-of-the-envelope math to get a sense of the overall trends. Back about 20 years ago when I started working on this stuff, what I noticed was that stated provincial debt levels for undergraduate borrowers (I had a bit more data back then) mostly worked out to be about equal to 2.5 years of borrowing. If that sounds low, think about the fact that a lot of students only borrow for one year, either because they drop out quickly, or because they only borrow during their fifth year of studies as they become “independent” by Canada Student Loans standards and hence no longer have their parents’ income count against them.
So, , let’s see what happens when we apply that math to the annual borrowing figures above: that is, for every graduated cohort, add together the last three years worth of annual average borrowing and then multiply by five-sixths to reduce the total to from 3 years to 2.5. As should be clear from the foregoing, what results from this will not be an absolutely accurate figure, but – unless students have started borrowing for longer – they should show some rough overall trends. Figure 4 show the results for Canada and the four largest provinces which together make up about 85% of total borrowers.
Figure 4: Estimated Average Debt by Province by Graduating Cohort, in Constant $2019, Canada Plus Four Largest Provinces, 1995-96 to 2019-20.
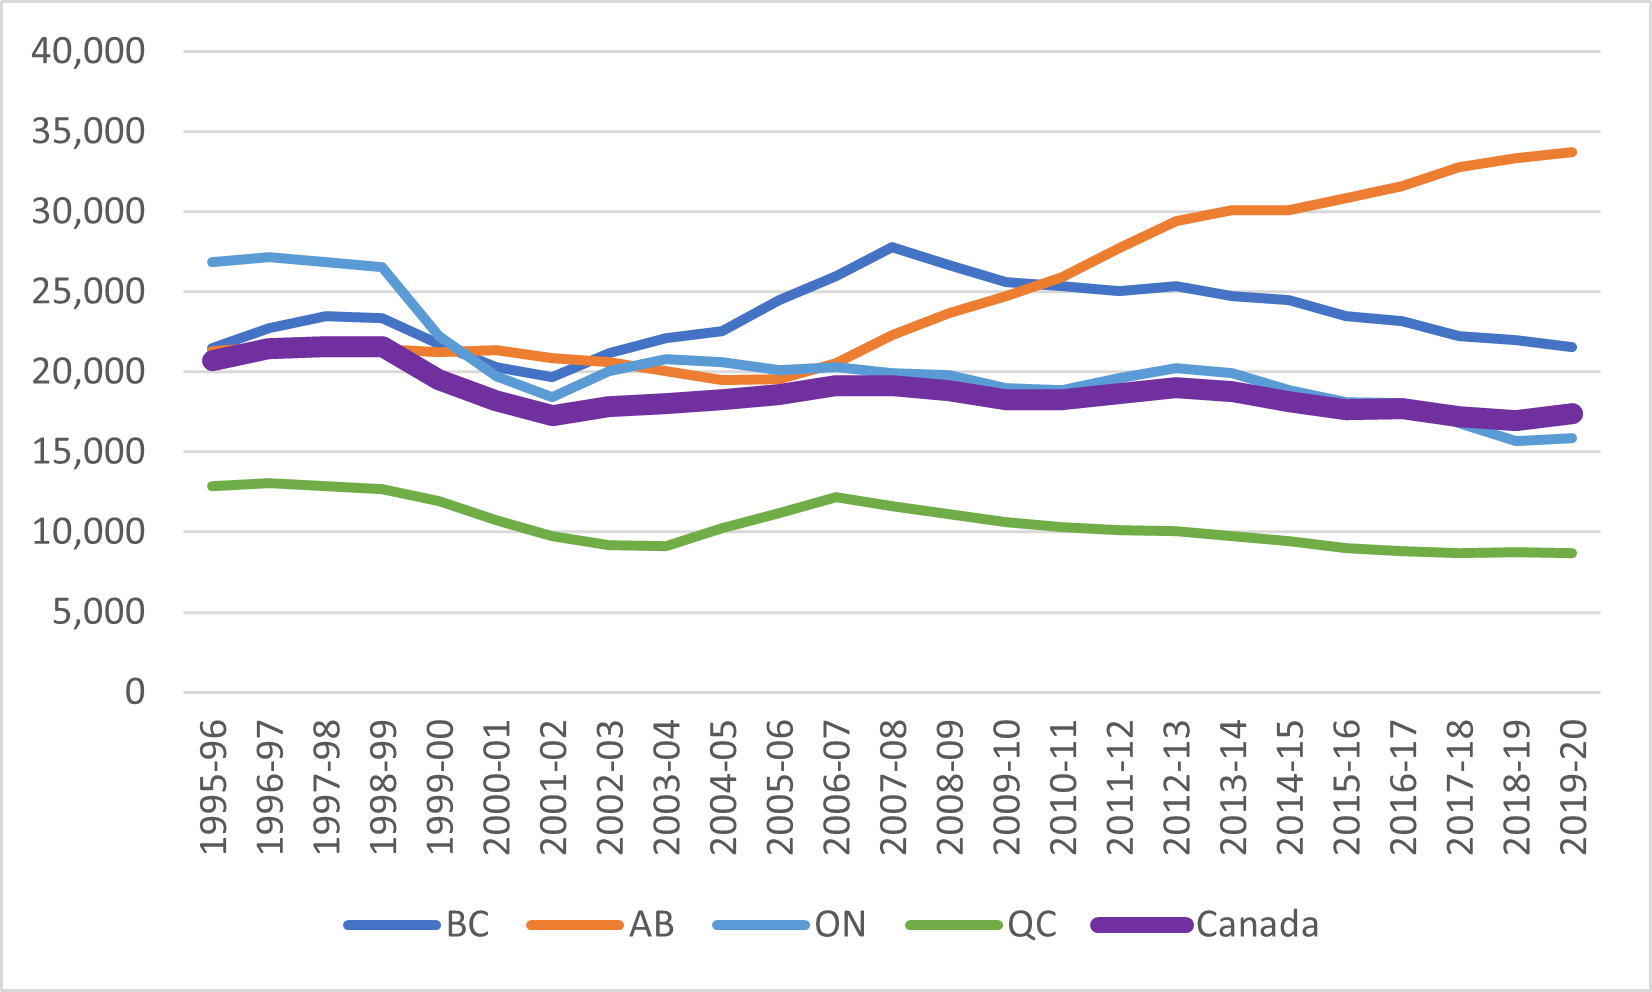
Now let’s be clear here: don’t take these figures as literally true. No other data sources suggests that debt has declined by 10-15% over the past two decades, and I am not claiming here that it has. In fact, I suspect that most provinces here are somewhat understated in absolute terms except for Alberta, which I expect is overstated. Presumably, the main condition which has ceased to hold is that undergraduate debt levels are more like 3x annual borrowing now than the 2.5x they were 20 years ago (which in part may have to do with the reduction in the number of students in one-year programs in private vocational colleges).
But what I do want you to focus on is this: there are some enormous differences by province here. Debt is at or just below $10,000 in Quebec, close to $15,000 in Ontario, a little over $20,000 in British Columbia and a quite astonishing $33,000 in Alberta. Again: don’t take the actual figures literally, any of them could be off by a few thousand. Still: that’s still a hell of a gap. And the directions these lines are taking – flat in Quebec, down in British Columbia and Ontario and rising steadily in Alberta – those are absolutely true, even if there is some doubt about the exact slope.
Why is this happening? Well, the big drop around 1999 seems to be partly due to the creation of the Millennium Scholarship Foundation, but more so to students borrowing less as the mid-90s recession faded. The drop in borrowing in Ontario is easily explained: as I have explained before, it had to do with the Wynne government’s decision to can various education tax credits and cram them all into grants. The rise in Alberta borrowing is mostly due to the Stelmach government’s decision in the wake of the 2009 oil-price plunge to axe grants and eliminate parental contributions on provincial student loans (and the subsequent NDP government’s absolute refusal to reverse course – this is a completely bipartisan failure). I am genuinely unsure what is going on in BC: grants have been going up there, but not by that much.
Just for the sake of completism, here are the data for the other six provinces (God, Canada is such an irritating country for which to produce graphic data). The Manitoba data is almost certainly wrong because borrowing was never that high to begin with, so something is off on the conversion ratio, but the others all look roughly right to me.
Figure 5: Estimated Average Debt by Province by Graduating Cohort, in Constant $2019, The Six Smaller Provinces That Can’t Be Jammed Into Any Moderately Readable Chart With the Others, 1995-96 to 2019-20.

Anyways: Canada is large and contains multitudes. There are always regional variations to national numbers. Try to dig into the details of the data of you can.


One Response
Alex, would it be true that graduates from the professional schools would have higher debts than those from other faculties? One hears of medical students graduating with close to (or even more than) $100,000 in debt. Law and engineering degrees also seem to lead to higher debt loads upon graduation. Of course, these high debts are balanced by higher salaries in the graduates’ first jobs. So, average debt upon graduation seems to need some context.