


For all sorts of reasons, higher education institutions find the need to “show value”. One of the ways they do this is through economic impact statements. My HESA Towers colleague Michael Savage has been doing a review of these across Canada and in a couple of other countries and has come up with a really simple framework for thinking about them. Today and tomorrow we’ll be taking an in-depth look at what these documents can and cannot actually explain.
Ready? Off we go.
Basically, your standard economic impact measurement is going to want to measure three things: the economic footprint of the campus, the impact on alumni earnings, and the downstream impact of research. Let’s take each of these in turn.
Economic Footprint. The footprint impact calculation really comes in two parts: the first being what the institution spends and the second being what students and visitors spend. In both cases, what analysts seek to do is capture the amount of expenditure that can be tied to the institution. The institution’s own expenditures are known as the “direct” impact, but these are then multiplied by a set of – wait for it – “multipliers” in order to derive what are known as “indirect” and “induced” impacts. This is somewhat complicated, but basically “indirect” includes money spent in the economy by businesses who interact with the university/college, while “induced” layers on top of that the money spent by people who get paid by those businesses.
So what you have here are a data challenge (how do we work out how much money is spent) followed by a multiplication challenge (how do we work out the indirect and induced benefits). Let’s take those two in turn.
Where institutional spending is concerned, the number is trivially easy to obtain. If there is one number every institution has a good handle on, it’s how much money is going out the door. Student spending is a bit tougher to grasp and requires some judgement calls. Tuition is used to fund operating expenses, so you can’t include that because it would be double counting. But you can count what they spend in the community: the only question is whose money to count (it’s definitely kosher for international and out-of-province students, whose expenditures would not otherwise circulate in the local community; perhaps less so local students who might stay in the area anyways, at least in major cities). As for how the actual student expenditures are calculated: sometimes they are based on student surveys and sometimes based on…well, it’s not always entirely clear. There seems to be a lot of “estimating” going on. One major UK consultancy seems to think international students spend about $70,000/year on living expenses, which certainly has the effect of juicing the eventual impact numbers.
As for visitor expenses… hoo boy. Pretty much every institution/contract analyst has a different way of calculating both the number of visitors to campus (usually a function of the number of students on campus, but the estimated number of visitors per students is typically anywhere from 1 to 8.5, with no real rhyme or reason), as well as of calculating the dollars spent by each visitor (anywhere from $40 to $300/day, again with not a whole lot of evidentiary back-up). Let’s just say, politely, that there is a lot of handwaving going on in these calculations.
Now, to the multipliers. You can get fancy with this, and some economic analysts will imply they are doing some kind of advanced econometric modelling. But StatsCan does its own input/output modelling which it gives out for free (wherein numbers vary slightly by sector and province), and as far as we can tell, the number is usually somewhere in the vicinity of 1.5. Indeed, there are a whole bunch of impact reports which use something called the “Sudmant method” (after Walter Sudmant, UBC’s former institutional research director and all-around mensch) in which they just forego any econometric modelling and just say “multiply by 1.5”. Not what you’d call scientific, but then… and you may be getting this impression already… neither are most economic impact reports.
Alumni Earnings. So, the footprint is one big piece of the puzzle. The next is alumni earnings. In theory, this one is easy: just work out how much your alumni are earning and report it, right? Well, no, it gets a bit more complicated. First of all, you need to sort out what geographic area you are reporting for (in Canada, it’s usually the province, since the target of these reports is usually the provincial government). Second of all you need to actually work out what those graduates are making (survey them if you have money, if not make up a plausible number using StatsCan’s data on graduate earnings). Then you need to work out what the premium is: that is, subtract a number which you think graduates would have made had they not gone to your university or college.
Got all that? That’s your alumni earnings impact. If you want to get fancy, you can also work out what the tax payments of all your graduates are too (some institutions do this, most don’t). It’s kind of a weird number in truth, because you’re counting many cohorts of graduates, not just one and it’s more of a stock than a flow. This is not a big deal unless you try dividing that really big number by a smaller one (say, annual government revenue) to work out a “return on investment”. This is not advisable. Fewer still grapple with the earnings students forego while undertaking their academic programs.
Research Impact. Finally, there is the question of how to measure the impact of research. This is… fraught. I mean, you can do things like measure the value of patents and licenses, and to some extent you can look at spinoff income, but these usually leave you with some pretty piddly numbers. So the standard practice instead is to make some extremely back-of-the-envelope calculations based on something called “Total Factor Productivity”, or TFP. Basically, TFP is that portion of GDP growth which can’t be accounted for by labour or capital and so we chalk it up to “knowledge” – a measurable portion of which comes from each individual institution. The calculation basically looks like this, with StatsCan and provincial estimates used to determine the percentages involved in the calculations:
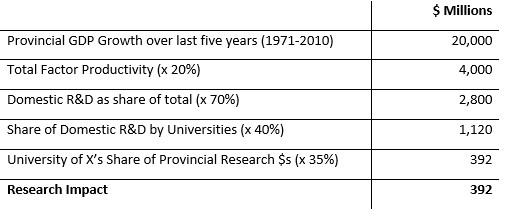
Yes, this is really how this stuff is calculated. It is not really science.
Anyways, those are the basics. Some analysts also try to quantify “social benefits” – lower rates of incarceration, smoking, drug use, etc. – but none are transparent with their methods of how they do this and it’s not clear that this kind of quantification is much more than handwaving.
Tomorrow, Michael and I will show you some of the tricks involved in juicing some of these statistics.


One Response
Much like
Economic Impact Analysis of Sports Facilities and Events– Eleven Sources of Misapplication by John L. Crompton
in Journal of Sport Management Vol 9: Issue 1 by Crompton, J. L. (1995).
doi–10.1123[slash]jsm.9.1.14 14–35
https://sci-hub.st/10.1123/jsm.9.1.14
or the fuzzy UBC self-study
https://preview.tinyurl.com/y3arcs7y