


Okay, so I goofed on Tuesday. Contrary to what I said, Colleges Ontario actually does publish sector-wide data on graduate incomes six months out – they just don’t publish it with the rest of the KPI data. Instead, it’s at the back of the graduate outcomes section of their excellent annual Environment Scan (thanks to Glenn for the heads up). So let’s take a look at what they say.
On Tuesday we noted that graduate employment outcomes for college graduates six-months out seemed to have taken a bigger knock in the recession than university graduates. To wit:
Figure 1: Percent of Ontario Graduates Employed Six-Months Out, by Graduating Class
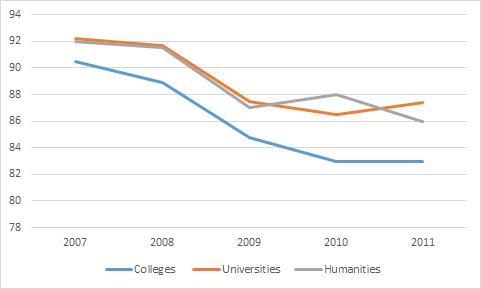
That said, although employment results have fallen significantly, the picture is somewhat better when you look at the changes in graduate incomes. Now, looking at “college” outputs is always a bit tricky because colleges offer so many different kinds of credentials. In Figure 2, we look at change-over-time in incomes for holders of each credential, and also the weighted average for all credentials.
Figure 2: Income of Ontario College Graduates Six-Months After Graduation, by Credential Level, by Graduating Class, in $2011
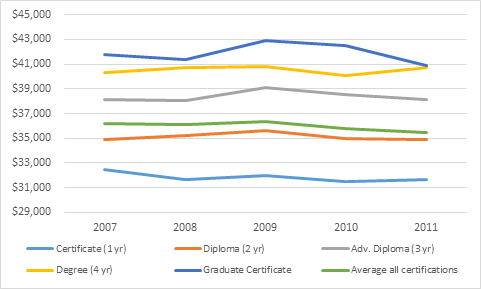
In one respect, Figure 2 is about what you’d expect: the longer a college program lasts, the more a college graduate makes (graduate certificates are a partial exception in that they are usually one-year, but they are meant to be delivered after four years of university, so the basic rule still holds). But it also shows that in real terms, the diplomas, advanced diplomas, and graduate certificates have held their value reasonably well, while certificates have lost 4% (degrees have lost more – 5% – but the numbers there are tiny and therefore subject to a bit more volatility).
Now let’s see how that compares to the six-month numbers at universities, which are below in Figure 3:
Figure 3: Income of Ontario University Graduates Six-Months After Graduation, by Field of Study, by Graduating Class, in $2011
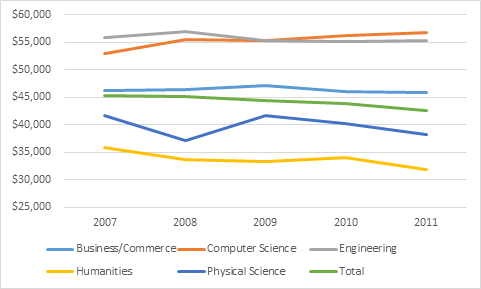
Figure 3 show a slightly different picture than what we saw with the 2-year out data back on Monday. Humanities and physical sciences still saw the largest fall, but at six months the 2011 computer science grads were 7% up on the class of 2007 (as opposed to 3% down at the 2-year mark), and overall the decline was 6% (as opposed to 13%). This implies that the job market for recent graduates actually got significantly worse between 2011 and 2013.
Finally, let’s compare college and university averages.
Figure 4: Income of Ontario College University Graduates Six Months After Graduation, in $2011
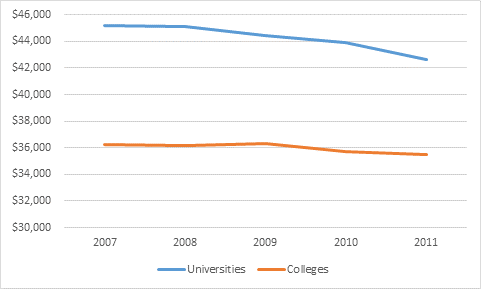
Figure 4 shows – unsurprisingly – that university graduates make more than college graduates six-months out. But it also shows that college credentials seem to be holding their value better than undergraduate degrees – down just 2%, rather than 6% for universities, over the period 2007-2011.
This is one of those rare cases where employment averages and income averages are moving in different directions. In one sense, everyone wins: in the near future, expect Ontario universities to promote themselves as a way to a safe job, and Ontario colleges to talk about how their credentials hold their value in bad times. And they’ll both be correct.

