


Y’all are used to me playing around with financial data in the post-secondary sector. Today, I want to play around a bit with data on cost escalation in the health sector, just so you all can see what the heck the post-secondary sector is up against when it comes to budget discussions in provincial cabinets.
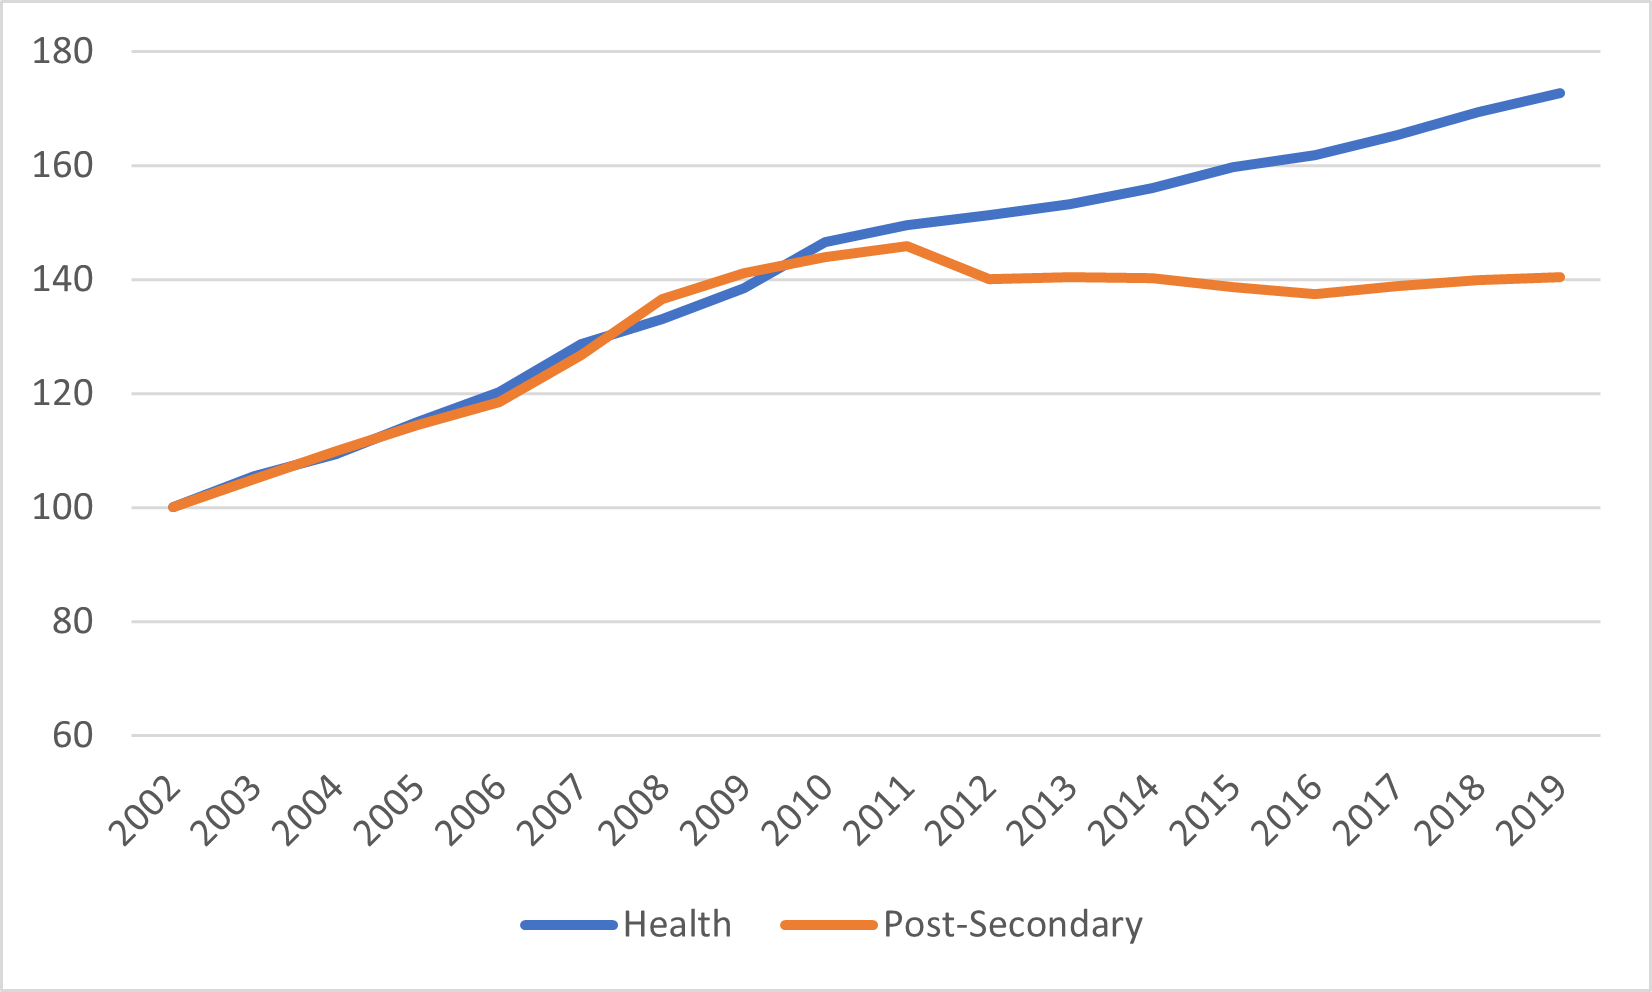
Let’s start with Figure 1, which shows provincial spending on health and post-secondary education since 2002. Turns out that in the 2000s, post-secondary education was getting spending boosts in line with the health sector of about 5% annually, after inflation (did the sector take this for granted at the time? Absolutely). But that all changed with the financial crisis in 2008-9. Once the dust settled from that crisis, provincial governments dropped funding to institutions somewhat, and then let it flatline in real terms. Meanwhile, the health sector continued to receive regular annual increases, albeit at a slightly lower rate of roughly 3% per year after inflation (I am cutting off the data in 2019 to avoid all the COVID-induced data chaos of the last couple of years).
Figure 1: Indexed Real Provincial Spending on Health Care and Post-Secondary Education, 2002-2019
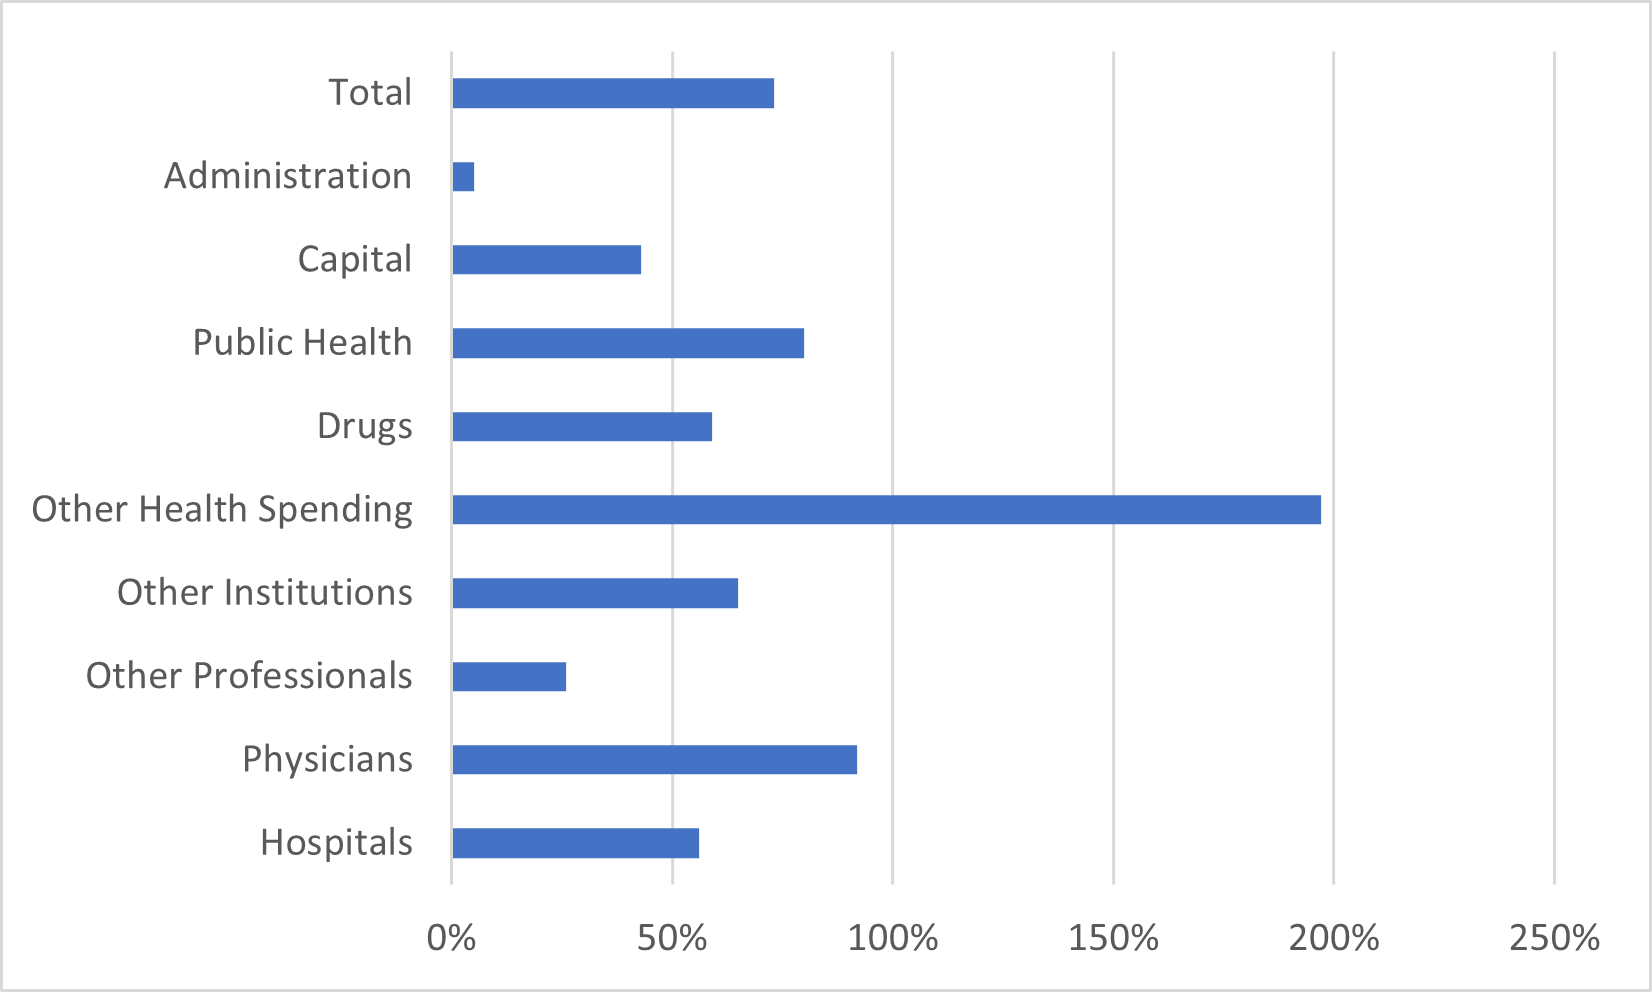
So, where is this money going? Figure 2 shows the distribution of the money by category (categories here are defined by the Canadian Institute for Health Information, a miraculously well-functioning national data centre functioning in an area of provincial jurisdiction – YOU SEE, IT CAN BE DONE). Over a third of all spending is classified under “hospitals” and another 22% is made up of physicians’ pay. “Other Institutions” includes various types of residential care facilities (eldercare, rehabilitation centres, etc.) and makes up 12% of all spending and “Other Professionals” includes specialists in dental and vision care as well as other kinds of non-physician specialists and makes up 1% of public spending (most of these people are paid privately). “Other Health Spending” mostly means home care, which is 10% of all spending and, as Figure 3 shows, growing much more quickly than other types of health spending.
Figure 2: Publicly-Financed Health Spending by Type, 2019, Canada
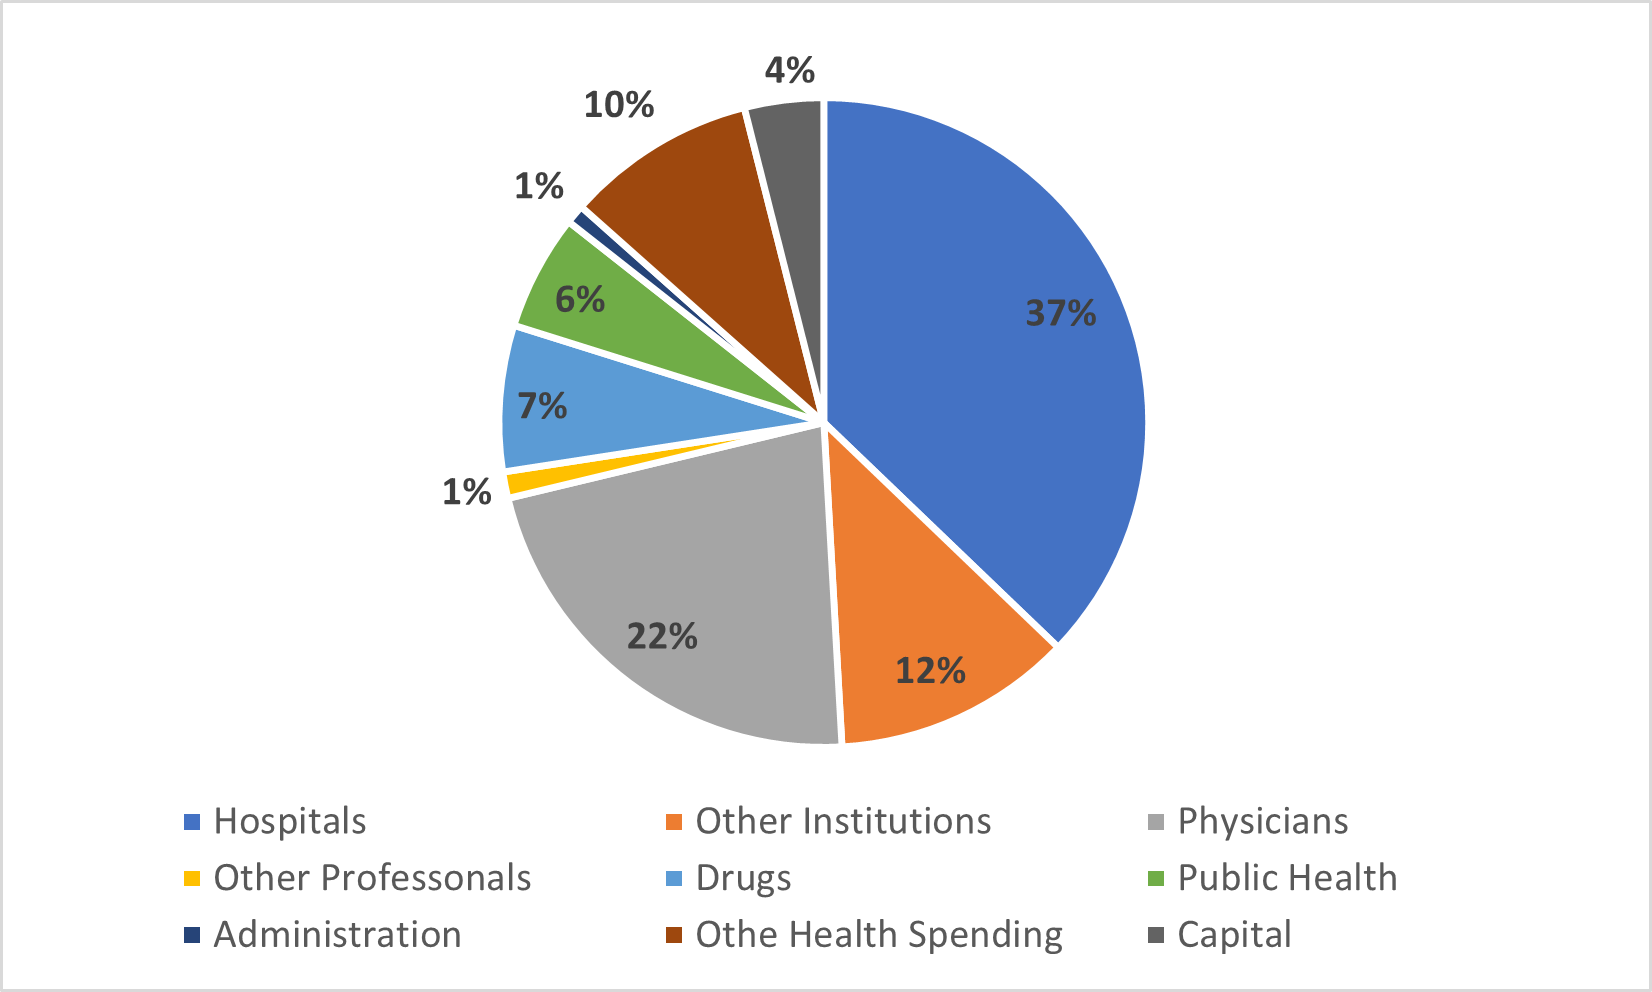
Figure 3: Percentage Increase in Publicly-Financed Health Spending by Type, 2002-2019, Canada
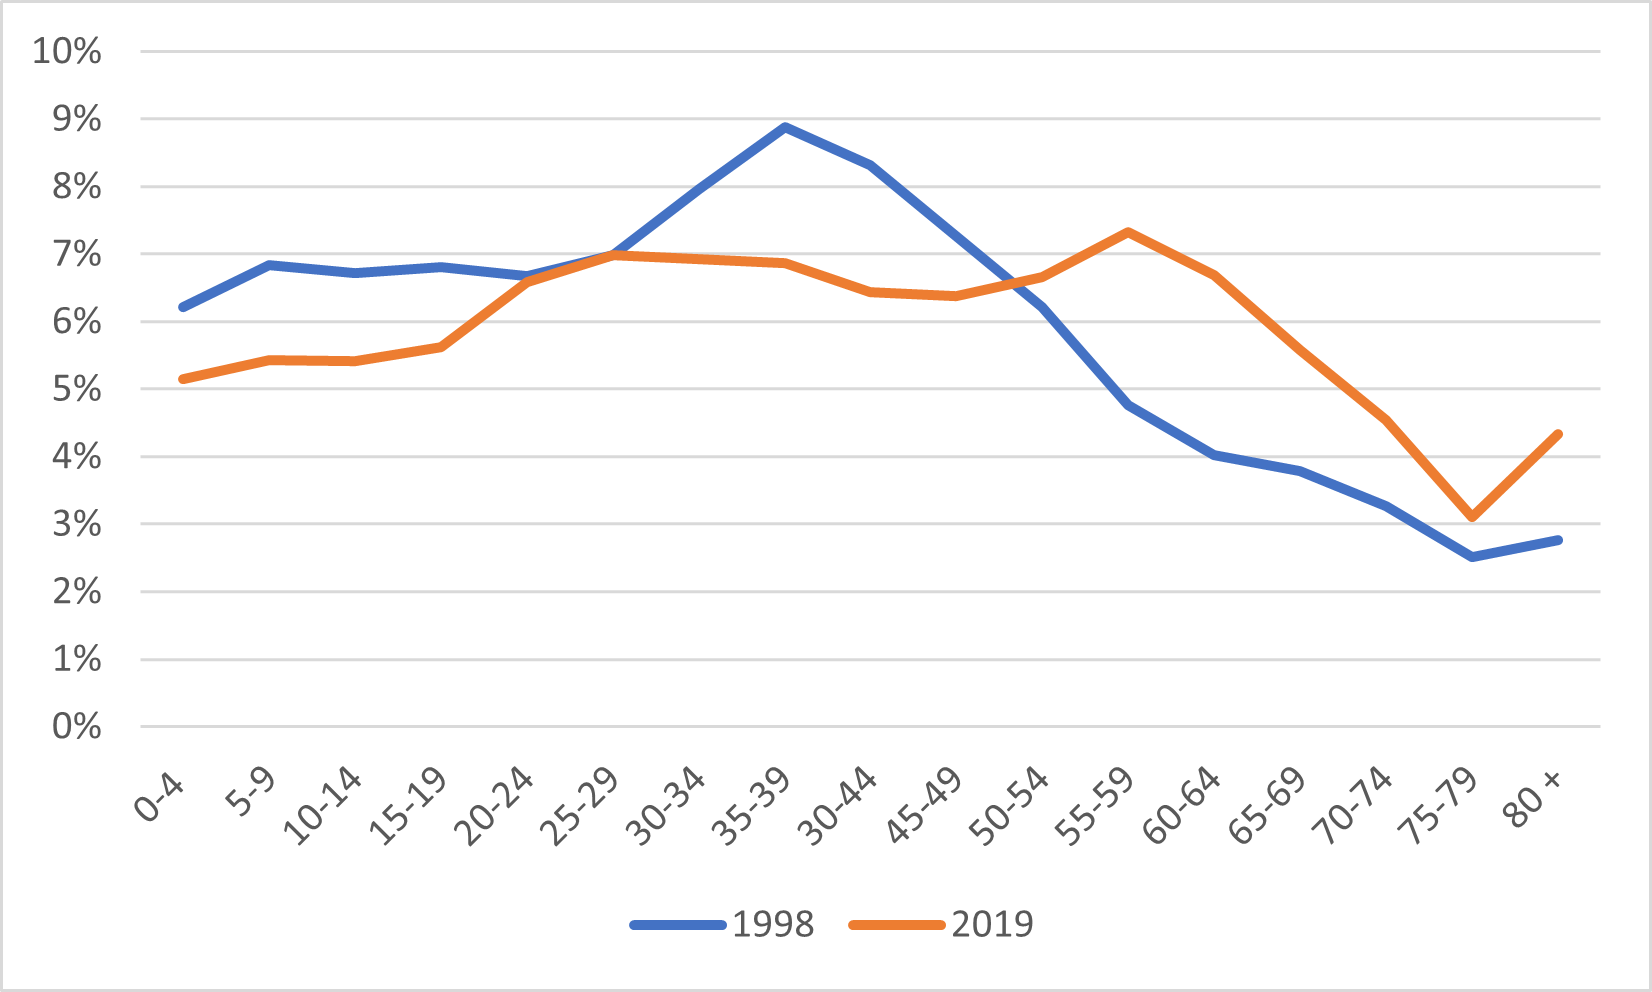
Now, one thing everyone knows about health spending is that population aging drives up the cost of health care. And since the average age of the population is increasing, that must be what’s driving the increase in health costs, right? Well, sort of. It is certainly true that the population is aging. As figure 4 shows, a significantly larger portion of the population is over 55 than it was twenty years ago.
Figure 4: Distribution of Canadian Population by Age Group, 1998 vs, 2019
But now look at figure 5. It certainly shows that per-capita health care expenditures are much higher among the elderly than among the young, and that as a result, an aging population tends to cost more to tend than a younger one. But look at those cost curves: health care is now more expensive at all ages than it was twenty years ago, even after controlling for inflation.
Figure 5: Per-capita Public Health Expenditures by Age Group, 1998 vs 2019 in real $2019.
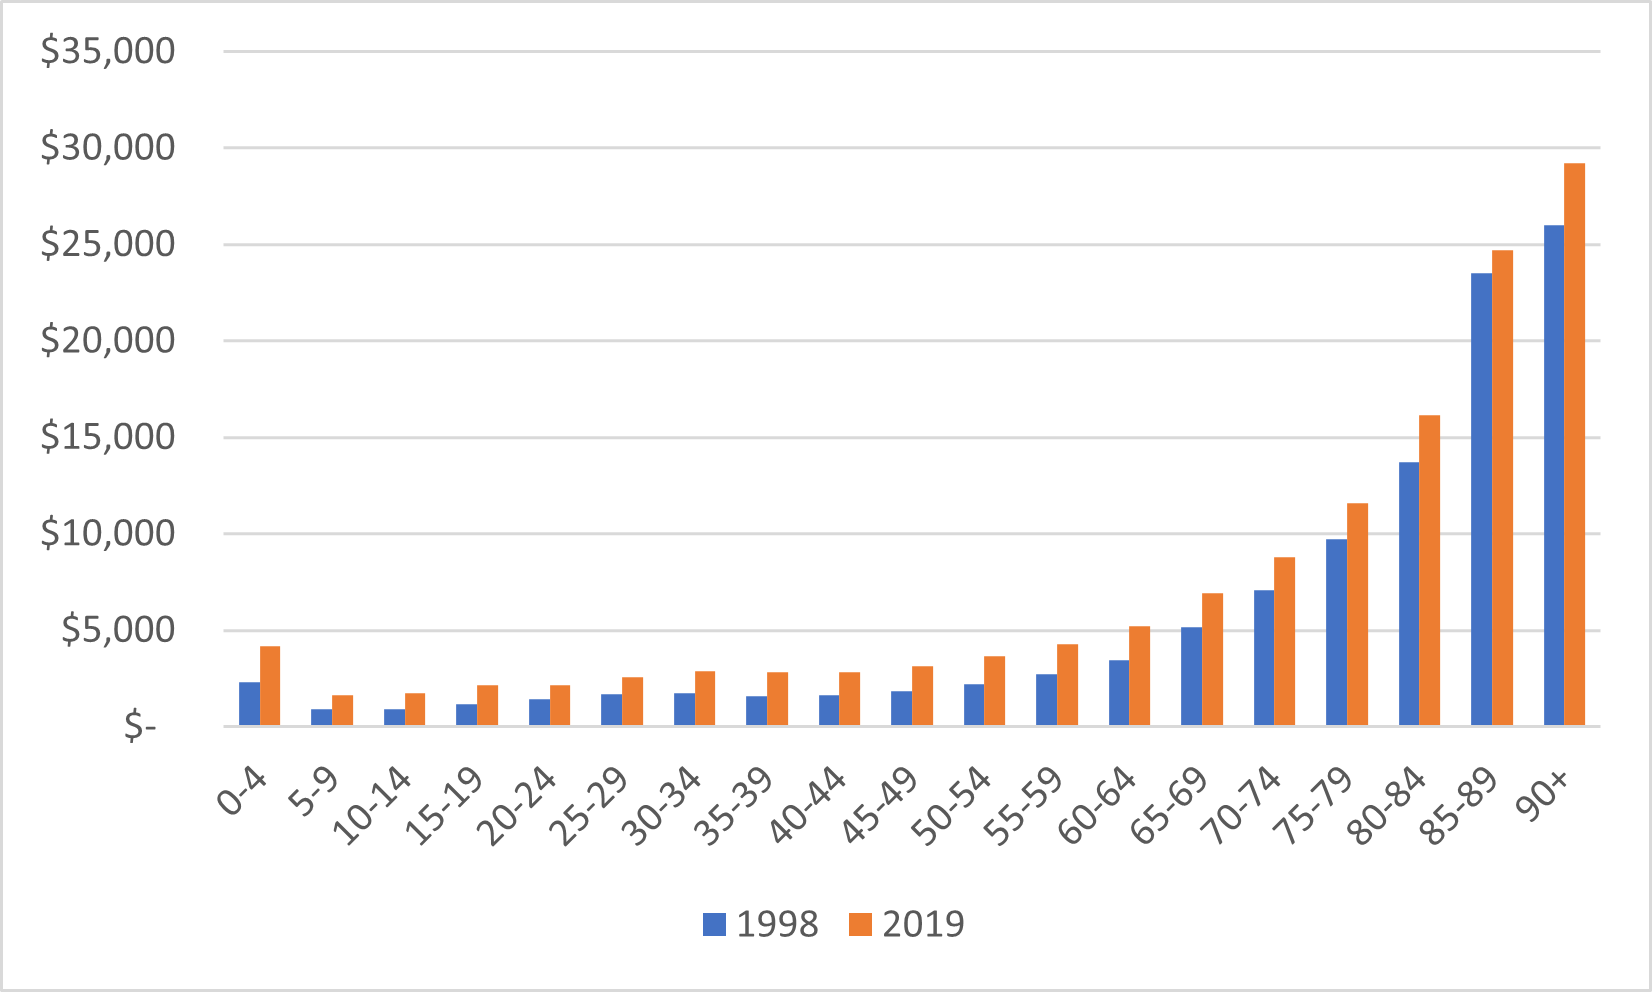
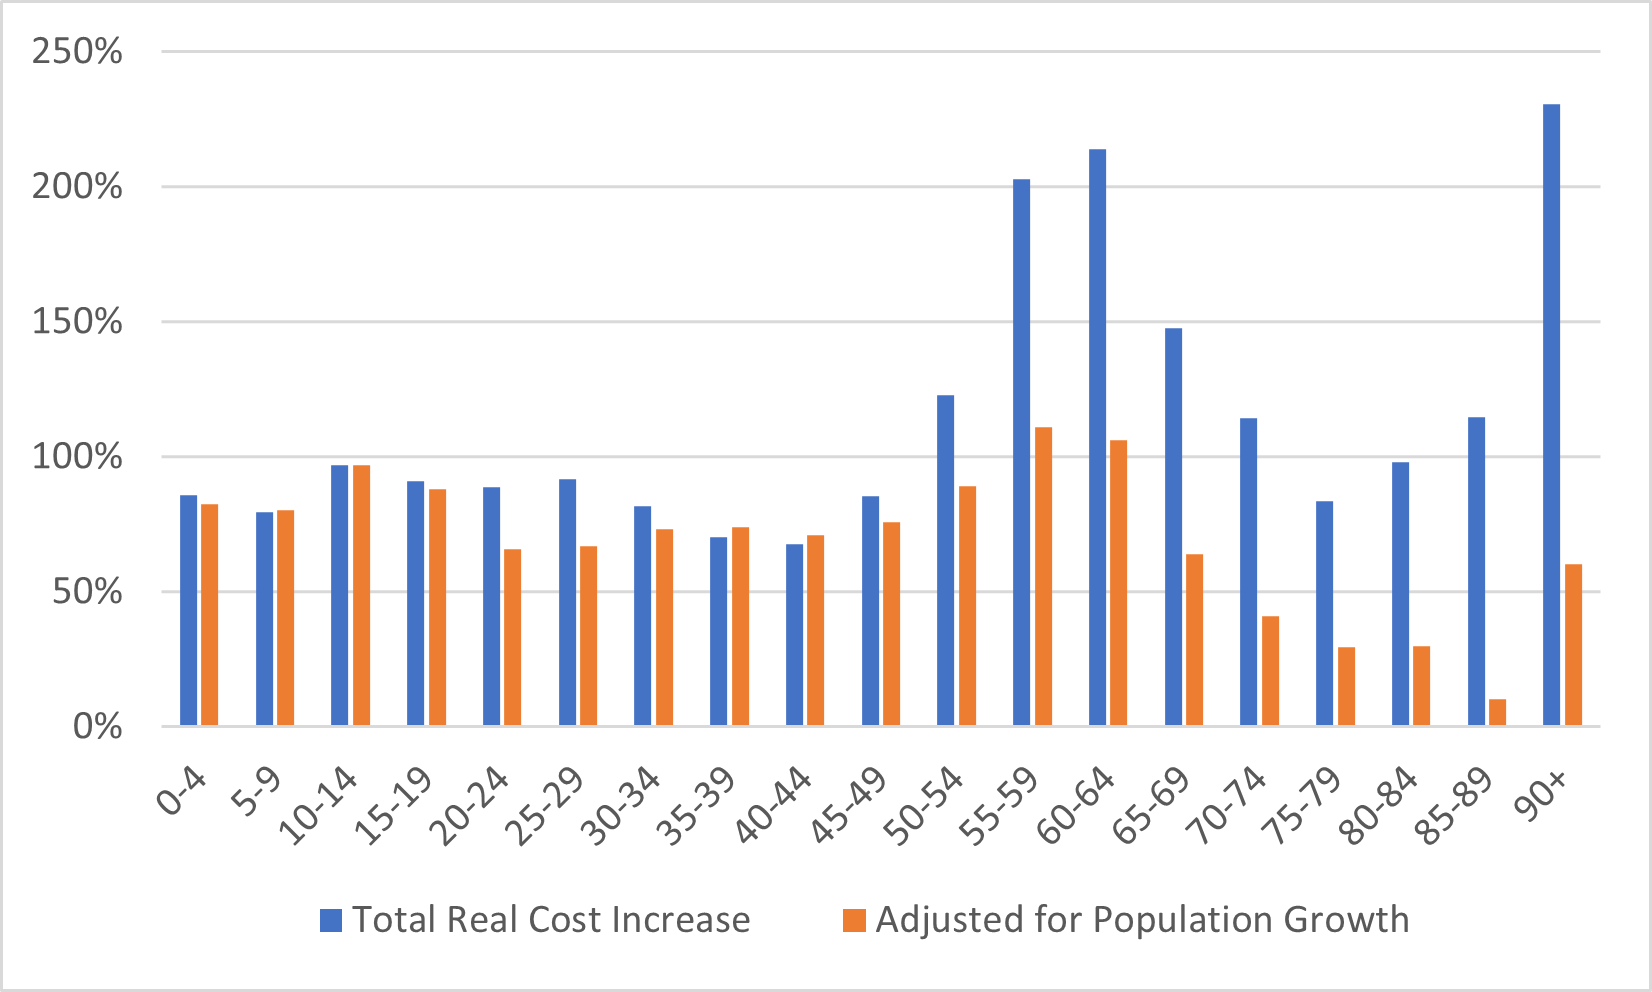
There are two other factors one needs to take into account here. The first is that as you go rightward on figure 5, there are fewer and fewer people in each category. That big jump in costs are mostly due to care in the last twelve months of life, which are still something like a third of all costs an individual will incur in a lifetime. That only happens once: increased life expectancy just pushes the big expenditures off by a few years. But the second is – as shown below in figure 6 – although health care costs are highest among the elderly, health care inflation is not. Costs are rising much more quickly among the under-65s than they are among senior citizens. In fact, by my calculations, only 45% of the increase in real health care costs over the past two decades is driven by individuals over the age of 65. The rest? Well, those are just your standard increase in labour costs and rising technological costs associated with new drugs and therapeutics. There’s new, better health care out there that we can buy and so we do. At all ages.
Figure 6: Change in Real Total Public Expenditures per Age Group, Canada 1998-2019
As far as I can tell, none of this is a particularly Canadian affliction. The international data is pretty clear that health care spending is rising as a percentage of Gross Domestic Product everywhere. It’s unclear to me that the age pattern of spending is similar elsewhere, but I have no reason to believe it is not and even if it were, it’s not clear to me if it would be a good thing or a bad thing – one could make a case either way.
My point though, is this: when pondering why public health care expenditures continue to increase and public expenditures in higher education do not, remember it’s not just because of demographics. Not only is the public content to see rising salary costs taken care of through public expenditure, it also demand higher quality health care (i.e. diagnostics and treatments) to be covered through the public taxation as well. Neither of these things is true with respect to higher education. Not only do they not want such things paid for through the public purse, they do not want to pay for it privately either – hence the frequent and widespread tuition freezes. And so, to the extent either are covered, they are covered by covert means unseen by the public (i.e. international students).
Want to reverse the trend? Find a way to make the public care about salaries and quality in higher education. Let me know how you make out.

