


As we all start to contemplate what life might look like in the “leaner” universities that will begin to emerge, I thought it was worth re-visiting data on institutional expenditures over time to see where institutions have grown the most and the least, and from that data deduce where institutions might prune.
Ideally, for this analysis, we’d have data on employment by function. But this is Canada so of course such data does not exist. What we do have, courtesy of the Financial Information of Universities and Colleges (FIUC) survey is data on aggregate salaries. That is, we know how much money in total was paid to tenured/tenure-track academics, we know how much was paid to people in instructional roles who are not ranked faculty, and we know how much went to everyone else (simply called “other” in the FIUC dataset). I am going to exclude that middle group from the analysis (because in the big picture they aren’t all that important, financially speaking), and focus specifically on academic pay and—especially—that “other” category, which I will refer to as “non-academic” as I think it’s a little more descriptive.
(One point to clear up here right away: in this data set, no academic wages show up in any administrative category. One could interpret this two different ways: either senior administrators who hold academic appointments are considered “non-academic” in this dataset, or the entirety of expenditure on senior administrators’ salaries get classified as “instructional.” My strong hunch is that it’s the former and “non-academic” therefore includes all admin salaries.)
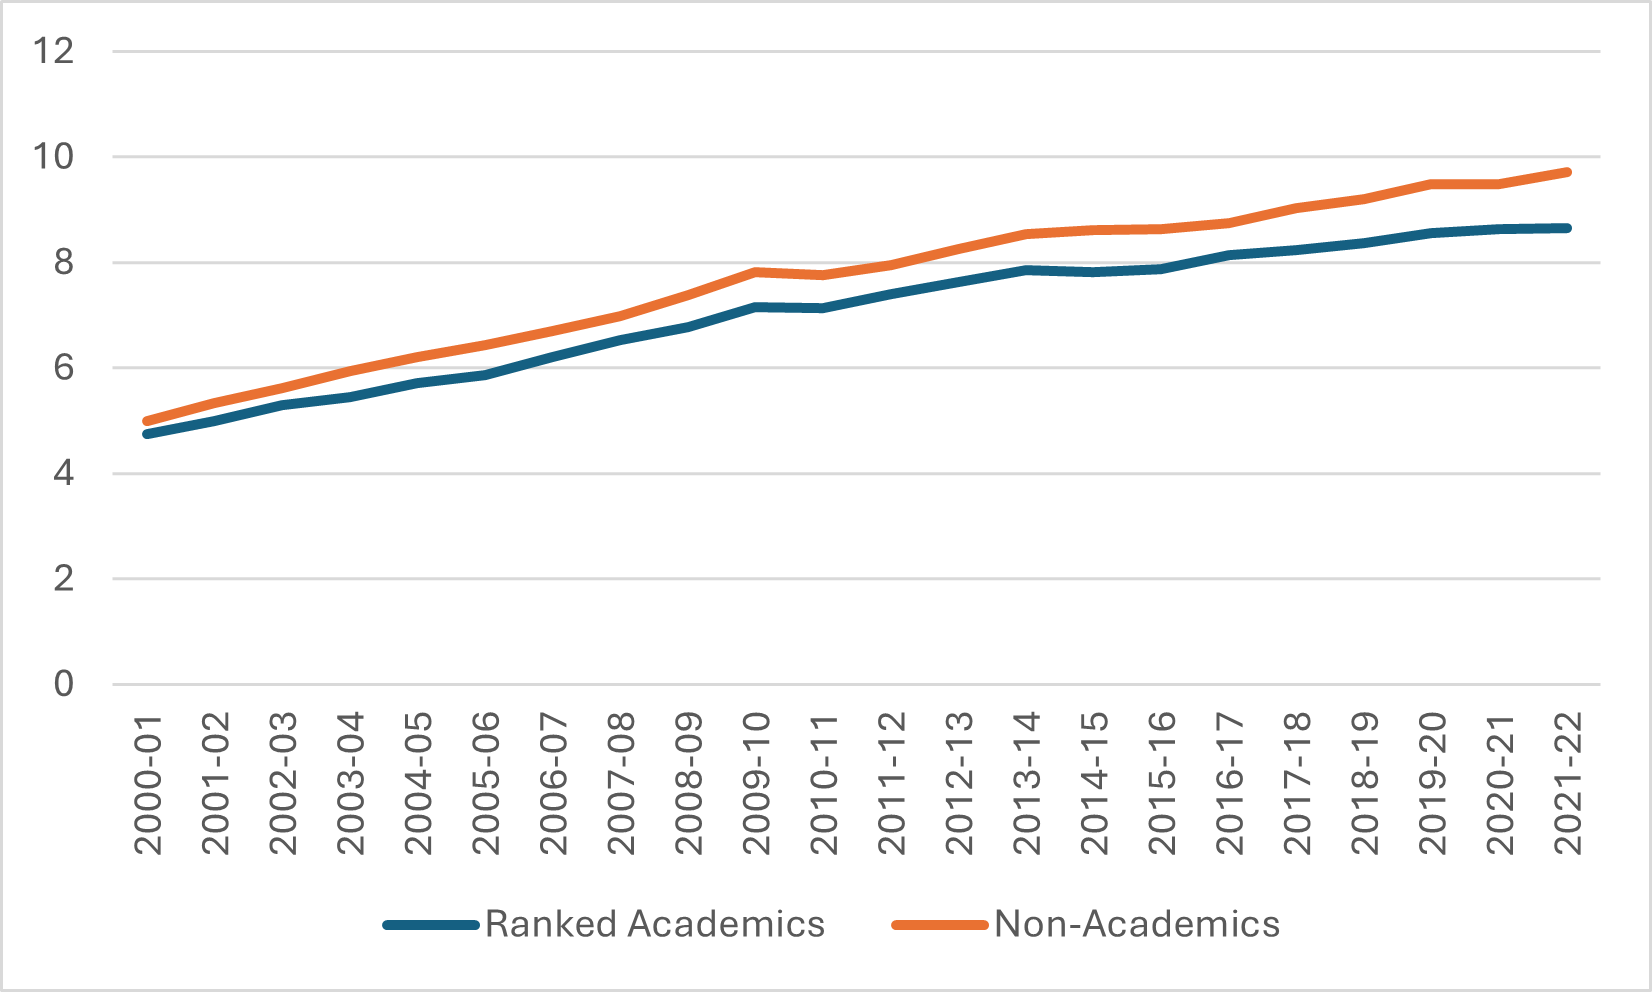
Anyways, let’s start by looking at growth in total wages. Figure 1 shows the growth in aggregate wages paid to (tenured & TT) academics vs. non-academics since 2000. In total, after inflation, total expenditures on academics have risen by 82%, while total expenditures on non-academics have risen by about 95%. Remember: in both cases we know this is a combination of real wage growth and growth in the number of candidates, and while we have some idea of how this breaks down for academics (40% growth in positions over the past 20 years, implying real wage growth of 20%) we have little data about the breakdown is for non-academics. That said though, on unionized campuses (i.e. nearly all of them), financial settlements for non-academic staff tend to track those of academic faculty pretty closely, which means that most of the “extra” growth in compensation to non-academics is down to growth in positions.
Figure 1: Aggregate Wages paid to Academics vs Non-Academics in Billions of $2021, Canadian Universities, 2000-01 to 2021-22
Now, universities are big places and “non-academic” wages cover a lot of different positions in a lot of different functions. To some extent we can disaggregate this. We know, for instance, how much money is going to non-academics working in “instruction” (which in FIUC terms basically means anyone who ultimately reports to an academic dean, so I have labelled these as “Faculties” below), “administration and academic support” (basically “central admin”), student services, physical plant, etc. The Library figure includes all librarians’ salaries, ever though at most institutions librarians are classified as faculty. Based on this data Figure 2 shows the real growth in total non-academic wages by type from 2000-1 to 2021-22.
Figure 2: Percentage Real Growth in Non-Academic Wages, by Type, Canadian Universities, 2000-01 to 2021-22
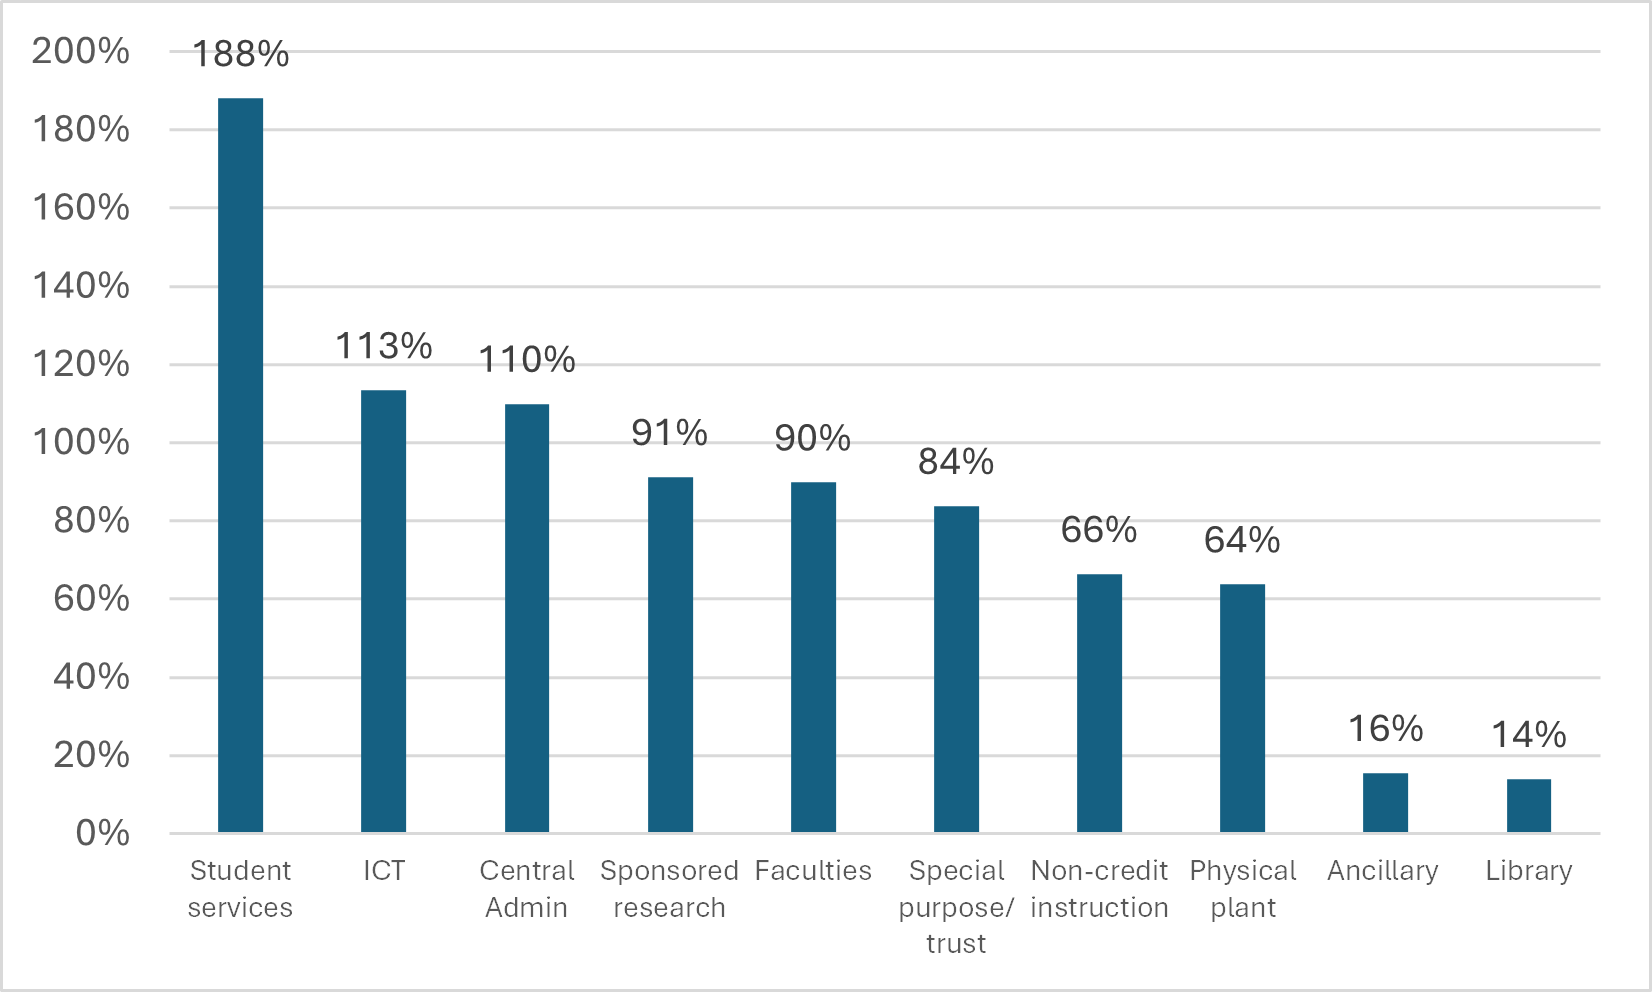
Seems like a pretty clear story, right? The biggest source of new spending on non-academic wages, in proportionate terms at least, is student services. Growth in ICT and Central administration are both above the 95% average for non-academics as a whole.
But…you have to be careful here because there was a change made in 2003. In that year, StatsCan split “External relations” from the overall central administration budget. So in order to look at growth in this area, it makes sense to cut the first three years off and look just from 2003 onwards. See Figure 3 for how that looks.
Figure 3: Percentage Real Growth in Non-Academic Wages, by Type, Canadian Universities, 2003-04 to 2021-22
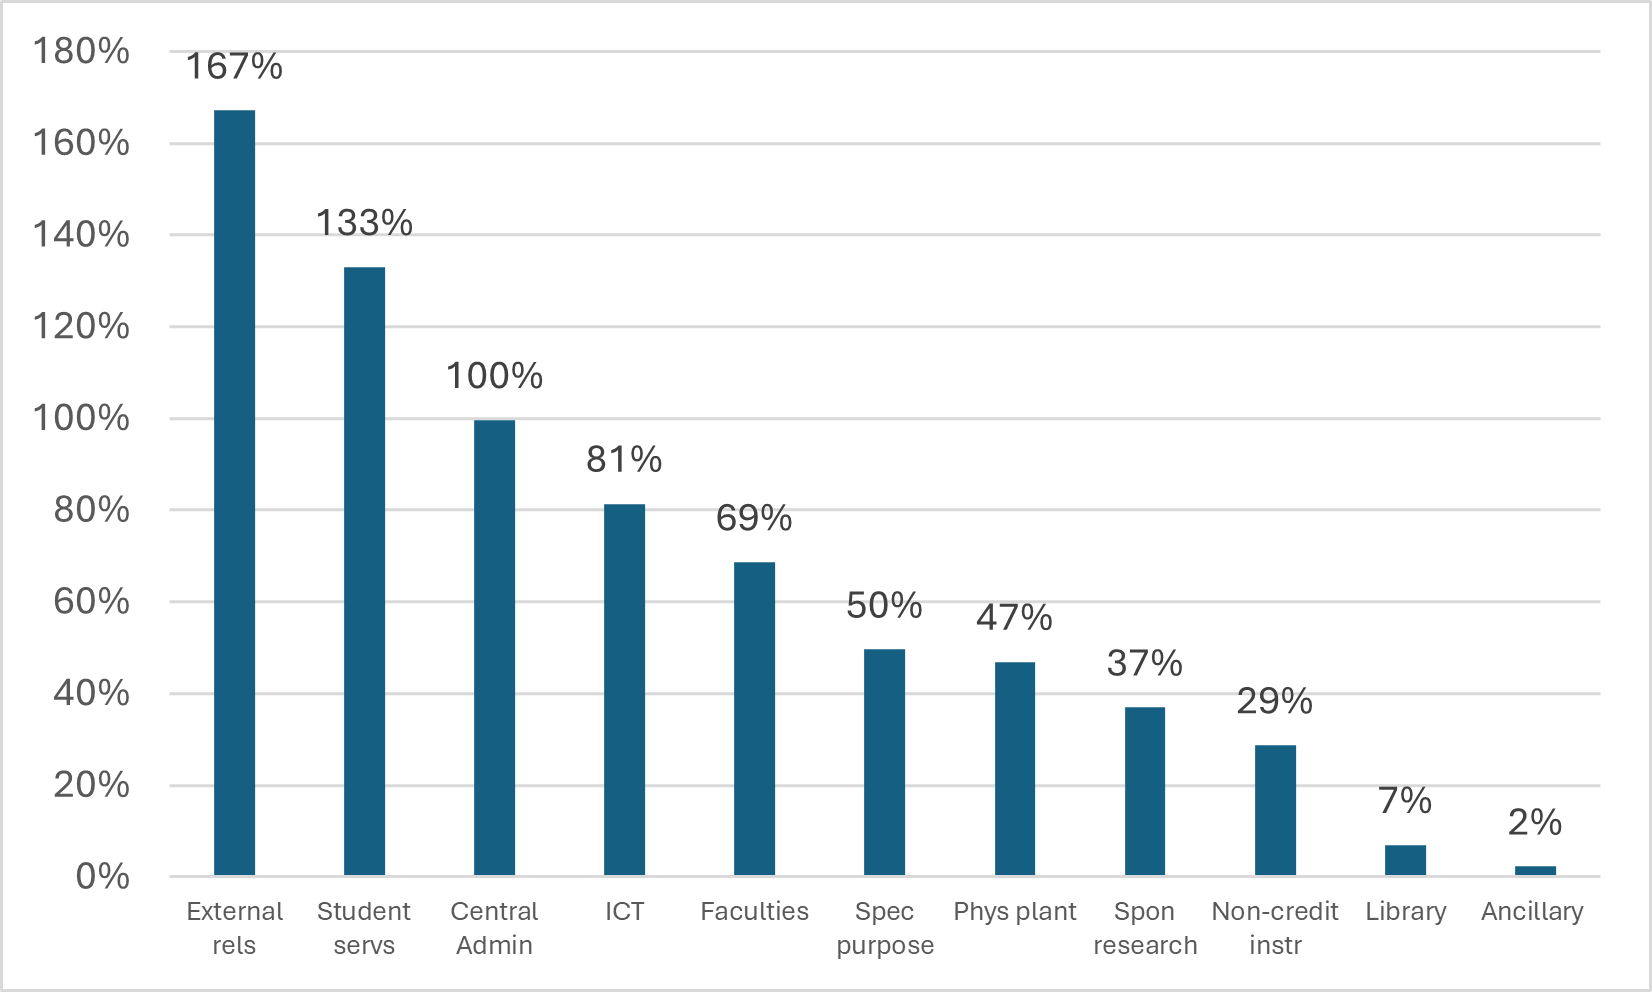
Ok now this is interesting. In eighteen years, spending on “external relations”—that is, advancement, government/community relations and (I believe) communication—has risen by 167% after inflation, or about 6% per year. And I have a feeling this is actually understating the growth somewhat: to the extent advancement and comms have been embedded in individual faculties over the past two decades (pretty common in the U15, less so outside it), some growth in this type of expenditure is actually being captured under “faculties” rather than “external relations.”
(I am focusing attention on areas of big spending increases because I think this is where the axe will fall but check out the other end of that table too: wages in ancillary services and libraries have barely moved in seventeen years. Ancillary I understand because a lot of jobs will have been contracted out over this period, particularly in food services, but libraries…whoo, that’s not good.)
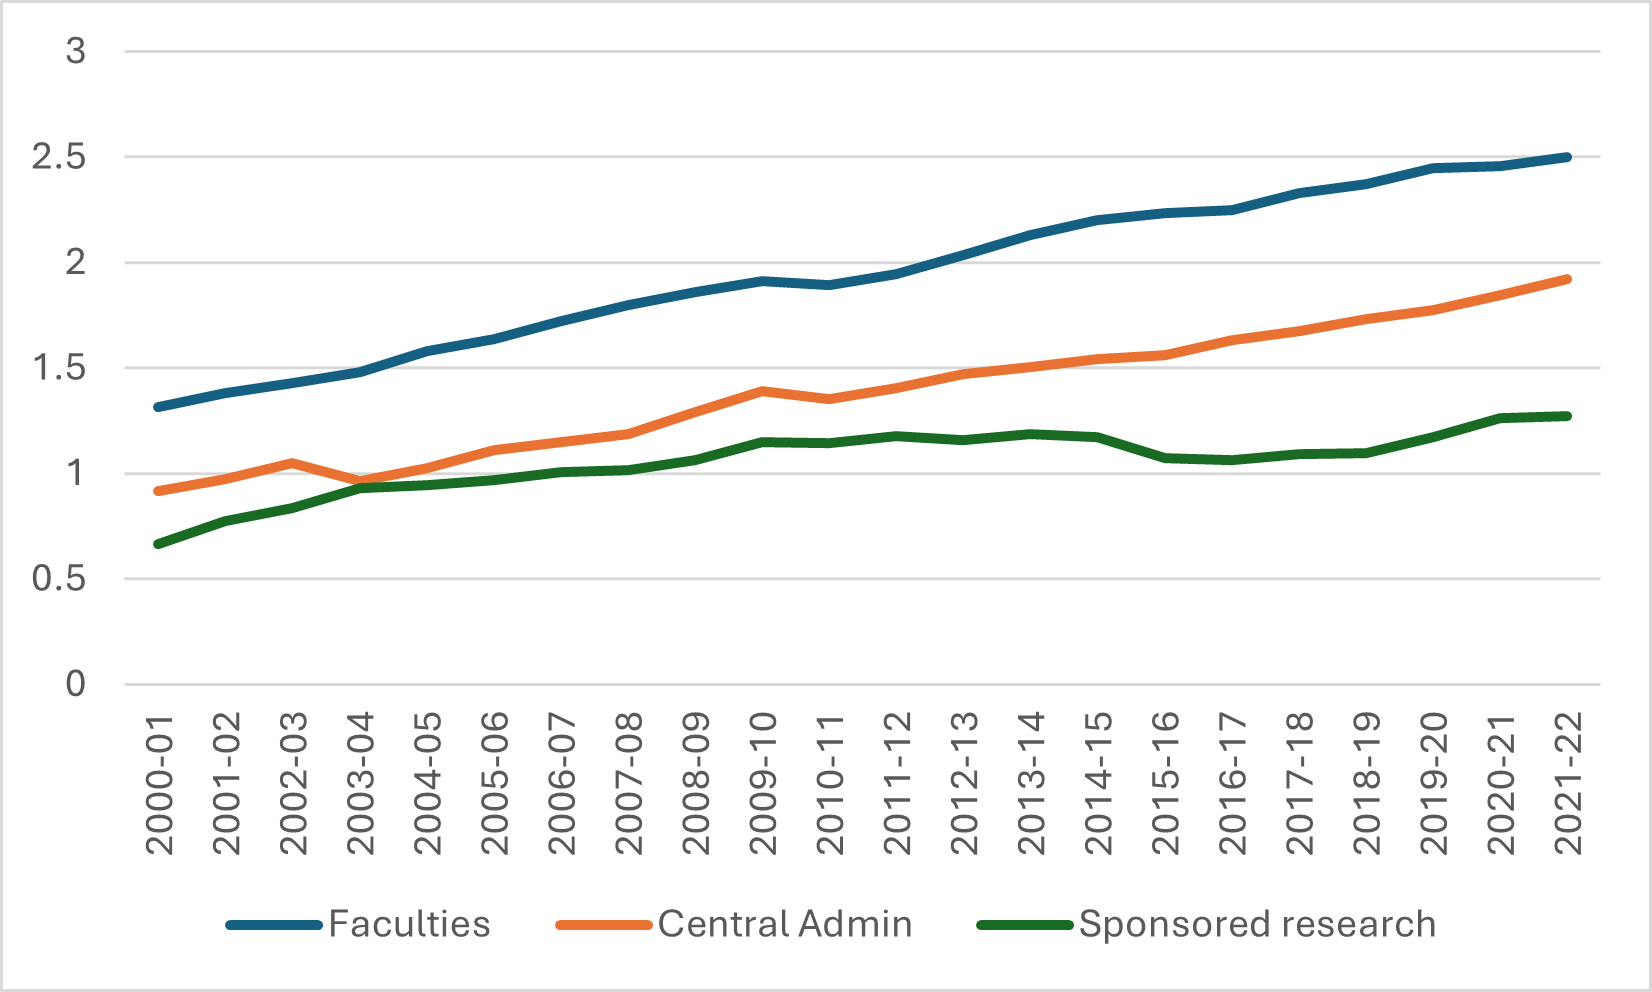
I have focused on percentage growth here because that’s the easiest thing to portray. But it’s a bit deceptive because of course not all categories are starting from the same base. So let’s look at absolute growth. I split this into two graphs because otherwise the graph gets messy. Figure 4 shows absolute growth for the three biggest categories of non-academic wage expenditure. What we see is that non-academic wages grew pretty steadily for both faculties and central administration—in contrast, non-academic wages in sponsored research plateaued quite awhile ago, right around the time federal government stopped increasing spending on research.
Figure 4: Aggregate Non-Academic Wages by Selected Type (1), in Billions of $2021, Canadian Universities, 2000-01 to 2021-22
And for completeness, here are the rest of the categories. The aggressive growth in both student services and external relations is quite evident here. From a combined $550 million in 2003, they have now risen to over $1.3 billion nationally.
Figure 5: Aggregate Non-Academic Wages by Selected Type (2), in Billions of $2021, Canadian Universities, 2000-01 to 2021-22
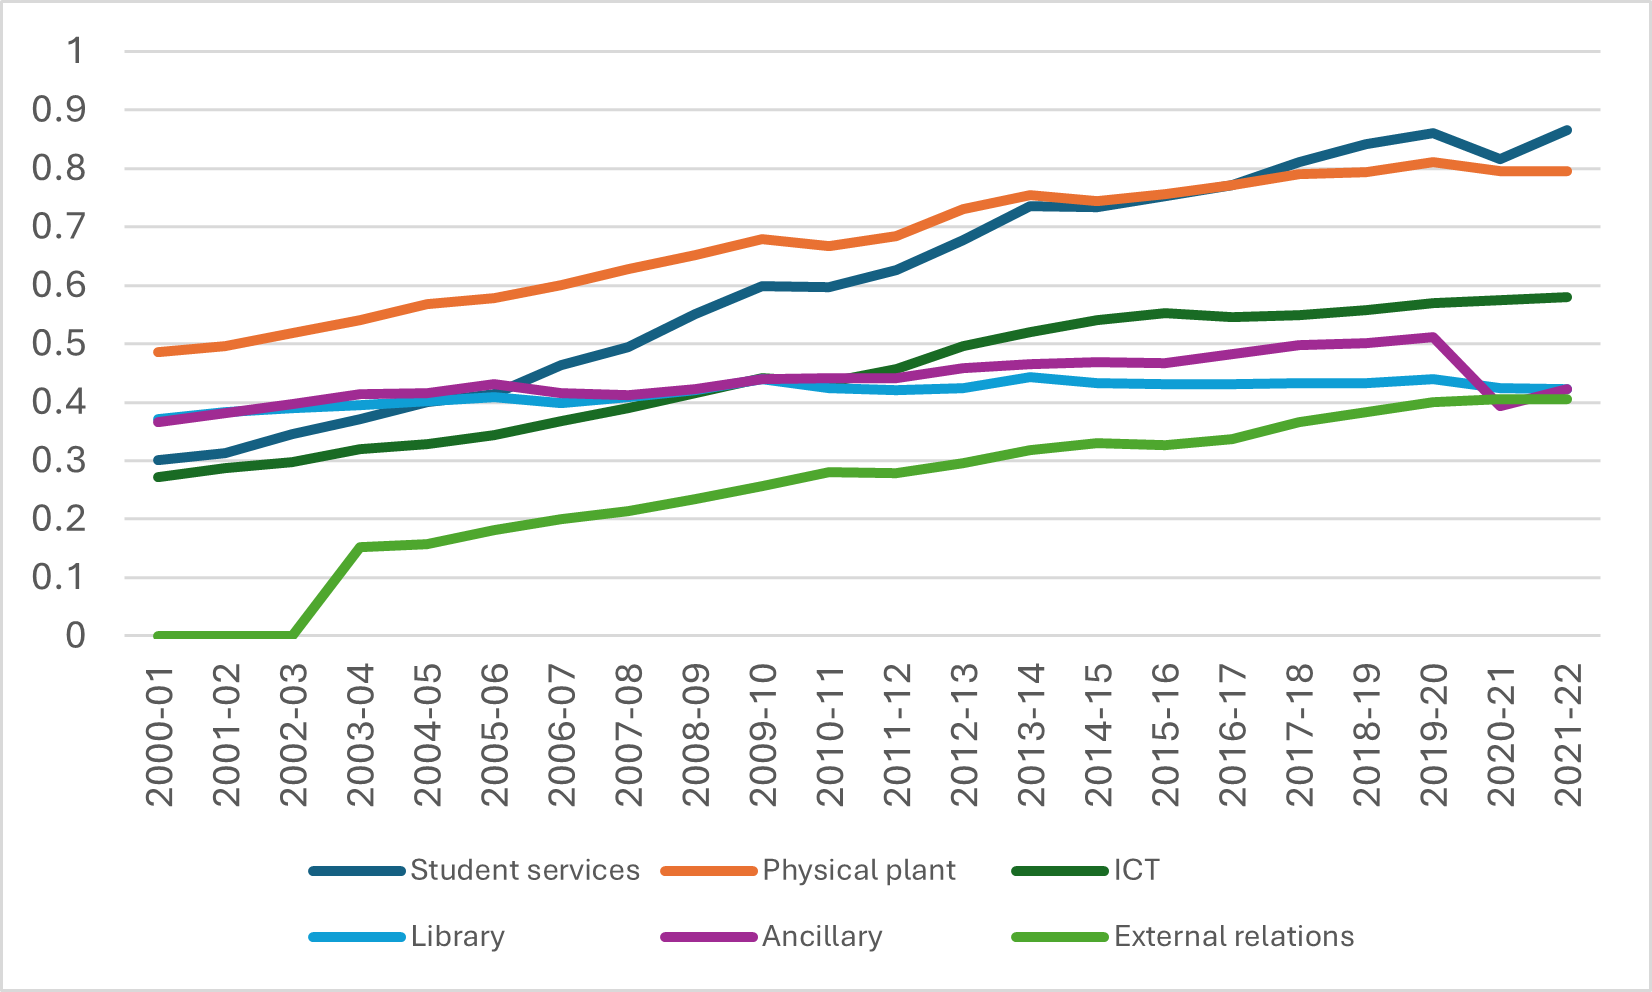
Of course, all of these are national results, and what’s happening at your local institution may not quite fit this pattern. But nationally, it seems to me that as institutions start to look to cut back, they are mostly going to come to focus fairly quickly on student services and external relations. There will be a lot of voices in defence of both these areas (can’t cut back on students, how much worse will funding get if we cut back on comms/GR/advancement, etc.). But in a world where governments, students and parents all seem to prefer cheap education to quality education, I would argue there is probably a certain logic to starting in these spots.


One Response
I think this points to something altogether more disturbing: as university funding is reduced, it becomes more important to attract the attention of government and potential students. Not only do universities lose funding directly, therefore, but they have to spend more money competing with each other in the arena of PR. The actual teaching and research — the raison d’être of universities — is cut twice.
Secondly, it would be interesting to know which universities have the lowest, to use a financial term, “management expense ratio.” In which do instruction and research represent the highest percentage of the budget? What are they doing that produces such efficiency?