


My friend and colleague Ross Finnie has just published a remarkable series of papers on long-term outcomes from higher education, which everyone needs to go read, stat.
What he’s done is taken 13 years of student data from the University of Ottawa and linked it to income tax data held by Statistics Canada. That means he can track income patterns by field of study, not over the puny 6-24 month period commonly used by provincial surveys, or the new 36-month standard the National Graduate Survey now uses, but for up to 13 years out. And guess what? Those results are pretty good. After only five years out, all fields of study are averaging at least $60K per year in annual income. Income does flatten out pretty quickly after that, but by then, of course, people are earning a pretty solid middle-class existence – even the much-maligned Arts grads.
Figure 1: Average Post-Graduation Income of Class of 1998 University of Ottawa Graduates, by Field of Study and Number of Years After Graduation, in Thousands of 2011 Constant Dollars
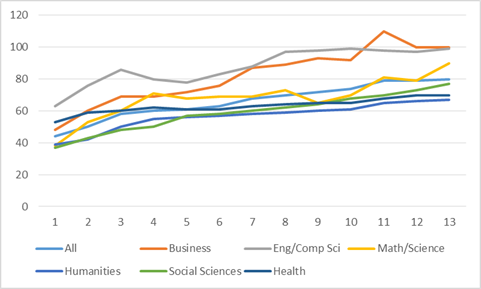
One of the brilliant things about this data set is that you can not only compare across fields of study in a single cohort, but also you can compare across years for a single field of study. Finnie’s data shows that in Math/Science, Humanities, Social Science, and Health, income pathways did not vary much between one cohort and another: a 2008 History grad had basically the same early income pathway as one from 1998. In two other fields, though, it was a different story. The first is Business, where the 1998 cohort clearly had it a lot better than its later counterparts; after two years out, that cohort was making $10K per year more than later ones, a lead that was then maintained for the rest of their career. In ICT, the fate of various cohorts was even more diverse.
Figure 2: Average Post-Graduation Income, Selected Cohorts of University of Ottawa Engineering/Computer Science Graduates, by Number of Years After Graduation, in Thousands of 2011 Constant Dollars
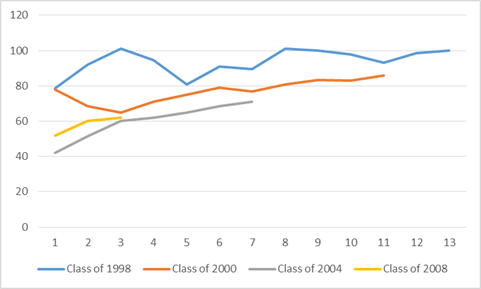
This is pretty stunning stuff: thanks to the dot-com bust, the first-year incomes of engineering and computer science graduates in 2004 was exactly half what it was in 2000 ($40,000 vs. $80,000). If anyone wants to know why kids don’t flock to ICT as a career, consider uncertain returns as a fairly major reason.
Also examined is the question of income by gender:
Figure 3: Average Post-Graduation Income of Class of 1998 University of Ottawa Graduates, by Gender and Number of Years After Graduation, in Thousands of 2011 Constant Dollars
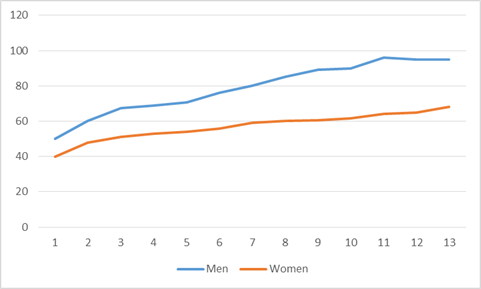
Two interesting things are at work with respect to gender. The initial income gap of $10,000 in the first year after graduation gap is almost entirely a field-of-study effect: take out Engineering/Computer Science, and earnings are almost the same. But after that, the gap widens at a pretty continuous pace for all fields of study. It’s most pronounced in Business, where top-quartile male incomes really blow the averages out, but the pattern is the same everywhere. Because of the way the data is collected, it’s impossible to say how much of this reflects differences in labour-market participation and hours worked, and how much of this is differences in hourly pay, but the final result – a gender gap of $20,000 to $25,000 in average earnings, regardless of field of study – is pretty striking.
Are there caveats to this data? Sure. It’s just one university, located in a town heavy on government and ICT work. My guess is that elsewhere, things might not look so good in Humanities and Social Science, and ICT outcomes may be less boom-and-bust-y. But fortunately, Ross is on this one: he is currently building a consortium of institutions across the country to replicate this process, and build a more comprehensive national picture.
Let me press this point a bit on Ross’ behalf: there is no good reason why every institution in the country should not be part of this consortium. If your institution is not part of it, ask yourself why. This is the most important new source of data on education Canada has had in over a decade. Everyone should contribute to it.
Nb. One tiny quibble about the papers is that they present everything in monochrome graphic form – no tabular data. To make the above figures, I’ve had to eyeball the data and re-enter it myself. Apologies for any deviations from the original.


3 Responses
Mr. Usher,
Is there a discrepancy with respect to salaries of Humanities graduates between the graph published in this posting and the one you published yesterday in your post, “The Arts Problem”? The latter seems to show quite a drop in salaries of Humanities graduates over the past ten years. Does the focus on the Ottawa job market account for this apparent discrepancy?
Thank you.
HI Christopher.
The data here shows the progression of income of a single cohort (1998) over a number of years. And as they get older, they get better off. What I showed yesterday was that the *starting* salary has been falling from one cohort to the next – it said nothing about the shape of the curve that those students will have in future. Also, Ross’ data essentially stops in 2008 – towards the start of the period when grad starting incomes began to fall. So there’s no contradiction in the data – both could be true without invoking the Ottawa theory as a reason (though I suspect that does in fact have an effect as well)
Thanks very much for clearing that up. I suppose my worry is that the data for the 1998 cohort might be very much a trailing indicator, which yesterday’s graph seems to confirm. And, as you suggest elsewhere, there is also the problem of correcting for the bad post-2008 economy.
Thanks again.