


On Saturday, the Globe and Mail ran a major story about the gender gap in pay at Ontario universities by Chen Wang and Robyn Doolittle. On the whole, I thought the piece was accurate concerning the politics of equity inside the academy. But one of the conclusions was that there is “steadily growing” gender wage gap at universities and this is codswallop, born of some seriously suspect data analysis. Consider the blog my way of correcting the record.
Wang and Doolittle’s data source is the Ontario Sunshine List, which is…a tricky data source. Basically, all public and para-public sector employees with incomes over $100,000 per year have their names and salaries published together. There’s nothing wrong with any of the data in it; the problem starts when you start trying to make comparisons over time, because no two snapshots in time are actually capturing the same population.
Let’s take 1999 vs. 2019 which are the start and end points in this Globe piece. In 1999, there were 2,069 individuals listed in the Sunshine List, of which, by my count, 70.8% were full-time academics of some variety (i.e. excluding anyone whose titled implied an administrative position, like “professor and chair of X”). In 2019, there were 20,673: almost exactly a ten-fold increase. Part of that increase has to do with general inflation: if you hold the limit of $100,000 in 1999 dollars constant, you find about half that number of new Sunshine List entrants, 10,372, are from inflation. Of this 10,372, 79.8% were full-time academics.
Now, according to Wang and Doolittle – who presumably had to hand-code all their gender data (which: Good Lord what a job) – a bit more than 10% of the 2,069 positions from 1999 were women, while in 2019, roughly 33% of the 10,372 were women (it rises to a little over 40% if you don’t adjust for inflation and just keep the $100,000 threshold in nominal dollars). I can’t be more exact than this because Wang and Doolittle don’t publish the actual figures, just this graph:
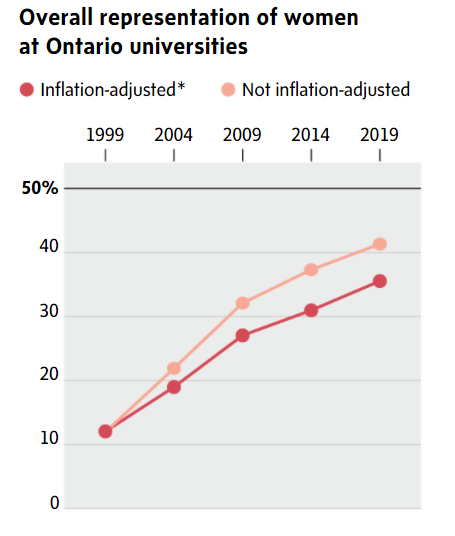
Still: pretty good news, right? Well, not according to Wang and Doolittle. They write: Two decades ago, 12 per cent of university employees in the top 10 percentile of earners were women. By 2019, just 26 per cent were women, and growth has been stagnant for years. (In 2009, it was 21 per cent.) The gender wage gap has also been steadily growing. In 1999, even though women were dramatically outnumbered overall, there was no pay gap, because they were evenly distributed throughout the salary bands. Today – with so many women stuck at the bottom – the gap is 5 per cent, or an average of around $10,000 per year.

No, no, no, no.
To draw a graph like that second one, you must have the same frame of reference. But the 1999 and 2019 samples are different in significant ways, the most obvious being that the latter is five times larger. What happened in the interim is not just inflation but also that real salaries grew significantly, partly because salary bands increased in real terms but substantially because of the end of mandatory retirement and the consequent huge jump in the number of staff with decades of seniority reaching the upper ends of those salary bands. It’s hard to tell exactly how much each contributes, but at a rough guess I would have said that real salaries are up by 20-25% or so over that decade. An apples-to-apples comparison of groups would therefore be not $100,000 in 1999 to $147,537 in 2019 – it would be more like $80-84,000 in 1999 to $147,537 in 2019.
It’s understandable why Wang and Doolittle didn’t do this: the Sunshine list cuts off at $100,000 and therefore it’s impossible to do. But as a result, what they did was the equivalent of taking snapshots of different sets of people at different points in time and claiming that there is a trend. The closest equivalent I can think of would be a Canadian election night. By the time the votes in Ontario are counted around 10PM or so, the board is usually fairly red. By midnight out east, when the votes from the west are counted, there is a lot more Tory blue on the board. This does not mean that there was a massive “trend” towards the Conservatives between 10 PM and midnight: it means the 10 PM snapshot was only a subset of the midnight snapshot.
To be clear: I am not saying there isn’t a lot of work to be done on pay equity in Ontario universities, or that there aren’t some inequitable arrangements with respect to pay (the fact that some institutions have to do these equity-based one-off catch-up adjustments every decade or so suggests there is a systemic problem here). What I am saying is that there is no basis to say that there is a growing pay equity gap.
Ultimately, if the Globe wants to do data journalism, it’s got to be a lot more careful than this.


One Response
I know that I am one month late to the game, but I am catching up on my reading. My own sense is that the sunshine list is simply not a good data source for salary data. It simply provides data on what an individual was paid during a year and does not indicate:
1. Whether the individual is employed full-time (so someone employed for only part of a year who earns over 100,000 is listed, or someone who decided to reduce to 75% for personal reasons)
2. Whether the individual is on reduced salary because of a research leave
3. Whether the individual has stepped-out for part of the year for maternity/parental leave
4. Whether the individual has been seconded to another role (where the salary is being recovered by the university)
5. Whether part of the salary involves an administrative stipend (department chair), additional teaching stipend, or other additional remuneration that runs through the university (stipend for editing a journal paid by the publisher, etc.)
All of these factors, combined, mean that it is extremely difficult if not impossible to look at salary change over time given the amount of noise in the data.