


Nota bene: There will be a podcast tomorrow, but the blog will be off all next week. Regular service resumes March 4.
Everyone seemed to enjoy the look at Presidential salaries a few weeks ago. And, since we haven’t done faculty salaries in awhile, today seems like a good day to do that.
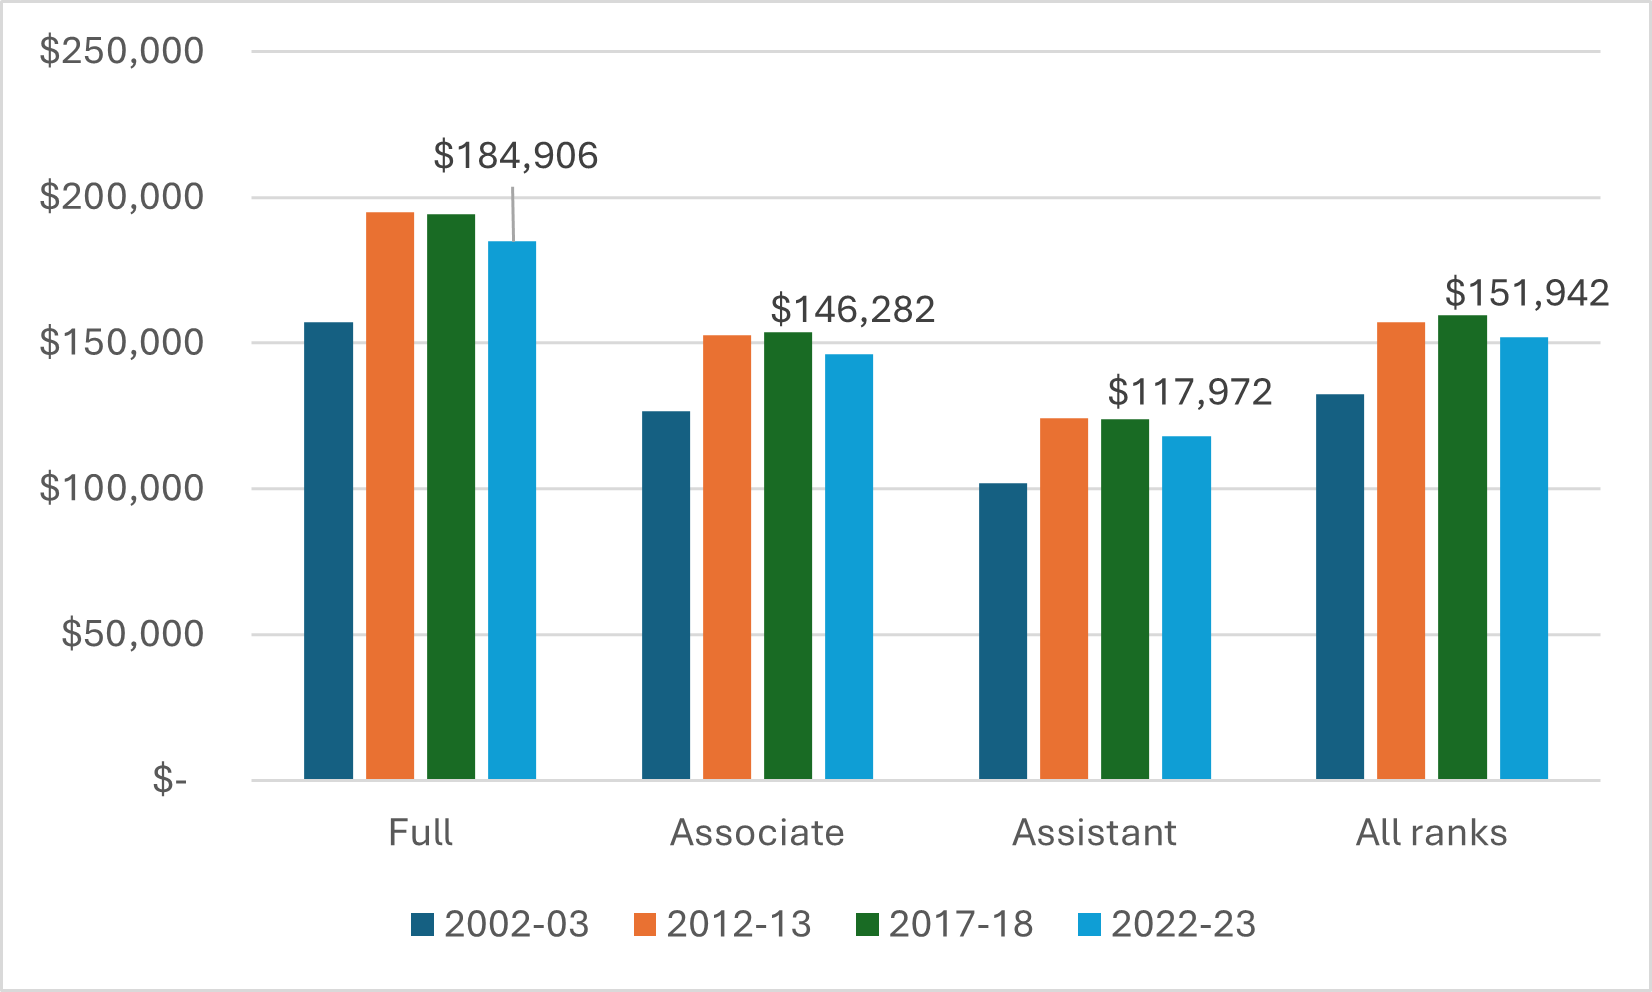
Let’s start with average salaries by rank. Figure 1 shows current averages by rank along with (inflation-adjusted) comparisons with 5-, 10-, and 20-years previously. Current faculty salaries are down somewhat in real terms on 2017-18 but still 15-17% higher than they were in 2002-03.
Figure 1: Average Full-time Faculty Salaries by Rank, Selected years 2002-03 to 2022-23, in real $2022.
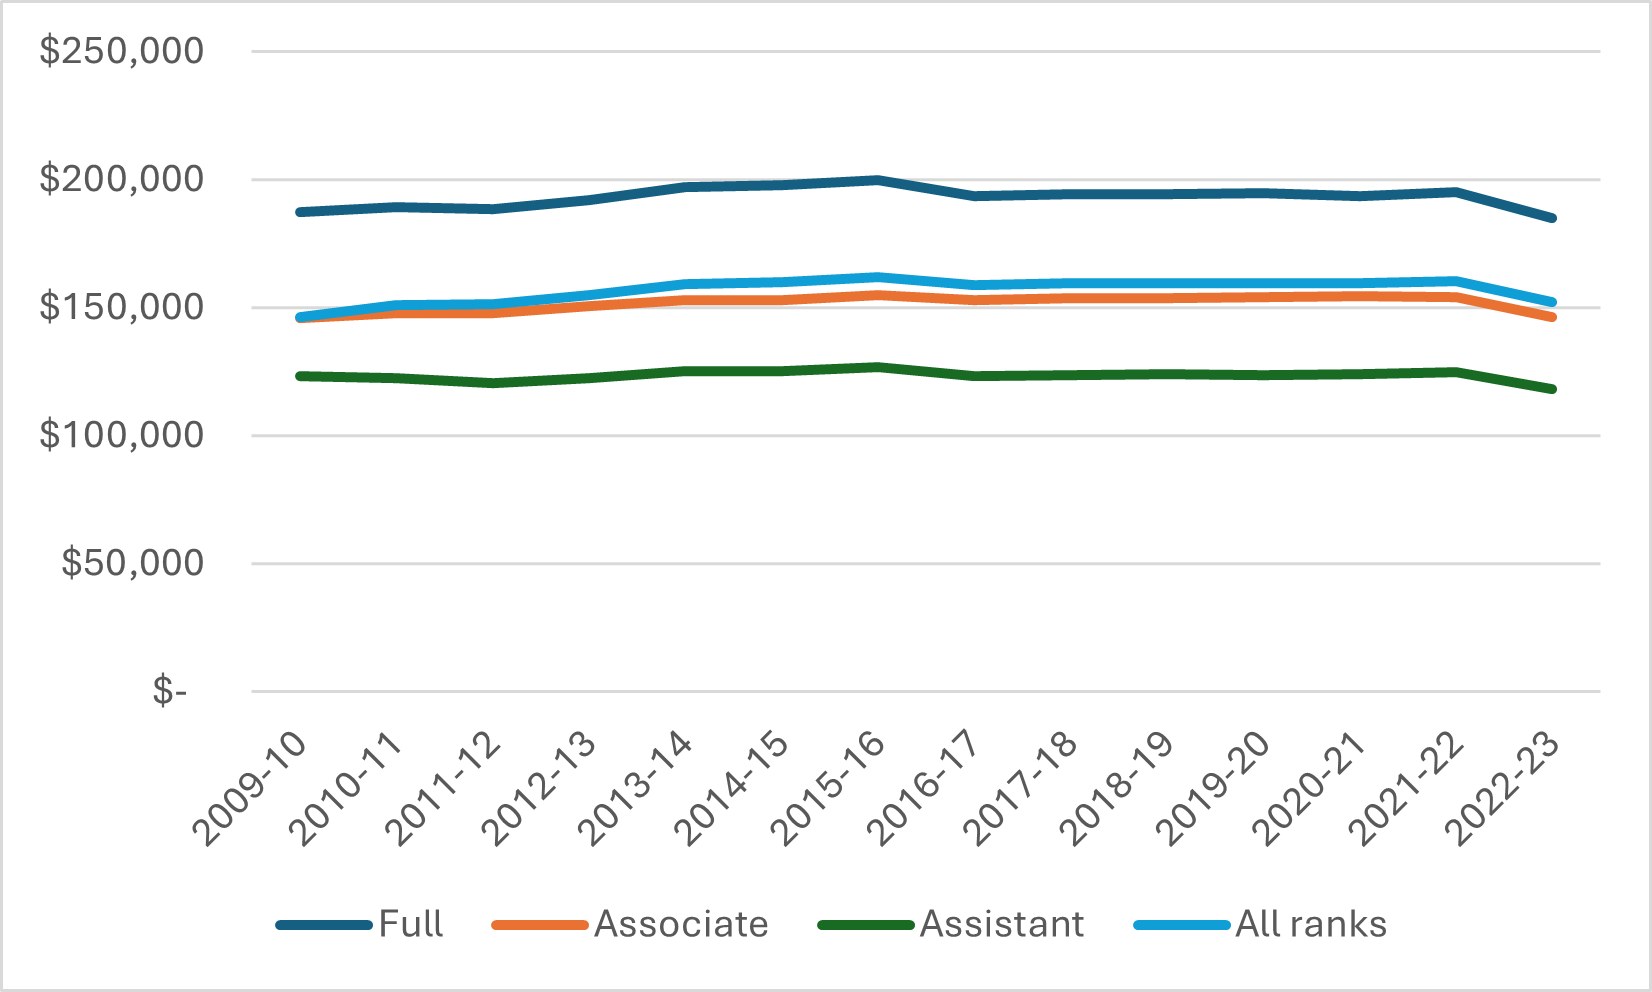
We can also take a close look at the last decade or so, when annual data is available (prior to 2009, the best Statscan can do for data availability is PDFs, and there are limits to my desire to extract data like that for a free email). Unsurprisingly, academics’ pay, in real terms, took a kicking in 2022-23 due to high inflation: overall, professors saw a drop of about 5% after inflation (which more or less mirrored the real drop in institutional income from governments). That left average pay in real terms lower than it was in 2009. (Note that there is a bit of a bump in all salary lines between 2011 and 2016: for reasons too boring to recount, most francophone and Maple League universities were absent in those years, and since their pay levels are slightly lower than those in the rest of the country, this absence made the average rise and their return made it fall.)
Figure 2: Average Full-time Faculty Salary by Rank, Canada, 2009-10 to 2022-22 in constant $2022
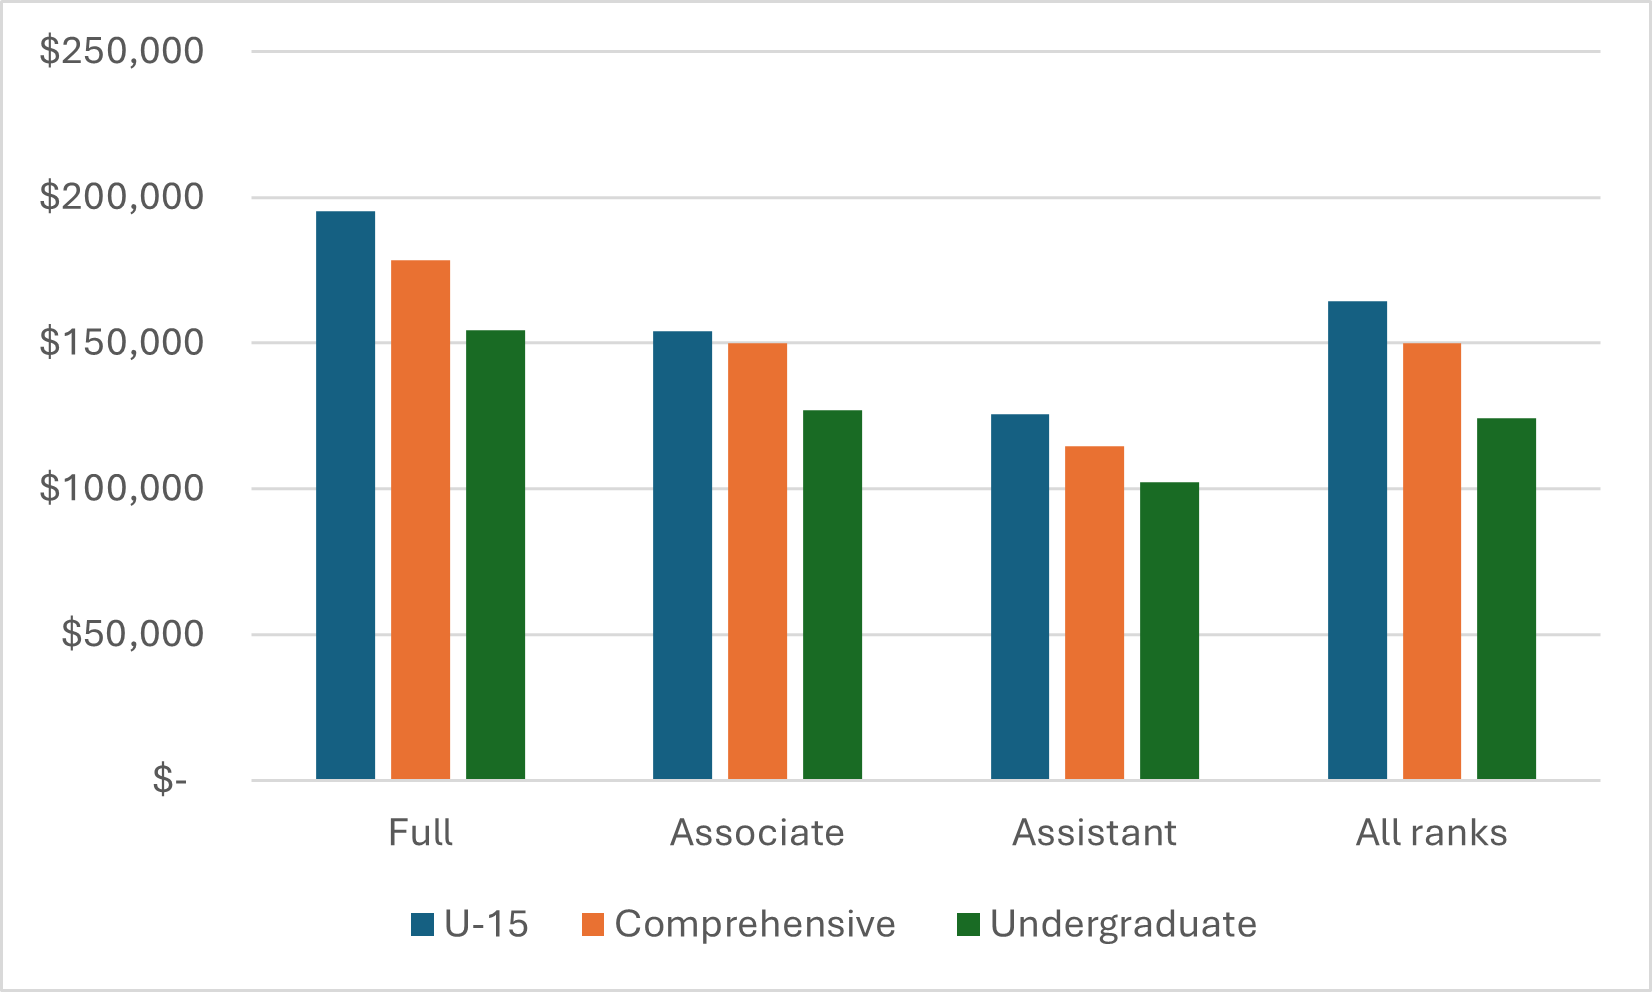
Of course, not all institutions have the same pay scales. On the whole, there is a pretty consistent relationship between research intensity and resources. Depending on the comparison used, pay is between 21% and 32% higher at U15 institutions than it is at predominantly undergraduate institutions. In Figure 3 I compare salaries across three types of institutions: the U15, “comprehensive” universities (the Maclean’s category minus Waterloo but including Sherbrooke), and “undergraduate” universities (everybody else).
Figure 3: Average Full-time Faculty Salary by Rank and Type of Institution, Canada, 2022-23
This is the place where I tend to throw in a quick comparison to the US, which is always fun (I would do more national comparisons, but in most countries data is scarce and the inequivalence of ranks tends to get in the way). Just to recap how I do these: the American Association of University Professors publishes average salaries for doctoral, master’s, and bachelor’s institutions, which I am going to take to be equivalent to U15s, comprehensives, and undergraduate institutions in Canada. This is probably a decent comparison for the U15s and undergraduates, but it’s a bit awkward for the comprehensives since several of them (York, SFU, Guelph) probably resemble US doctoral institution more closely than anything else. So be it. I convert US salaries to Canadian dollars by using OECD estimates for purchasing power parity ($1US = $1.165 Canadian). And finally, note that American profs are not salaried year-round (they are based on a 9-month school year); for doctoral universities only, I assume a summer income from research projects equal to 2 months of salary for the 69% of researchers at these institutions who hold external research grants.
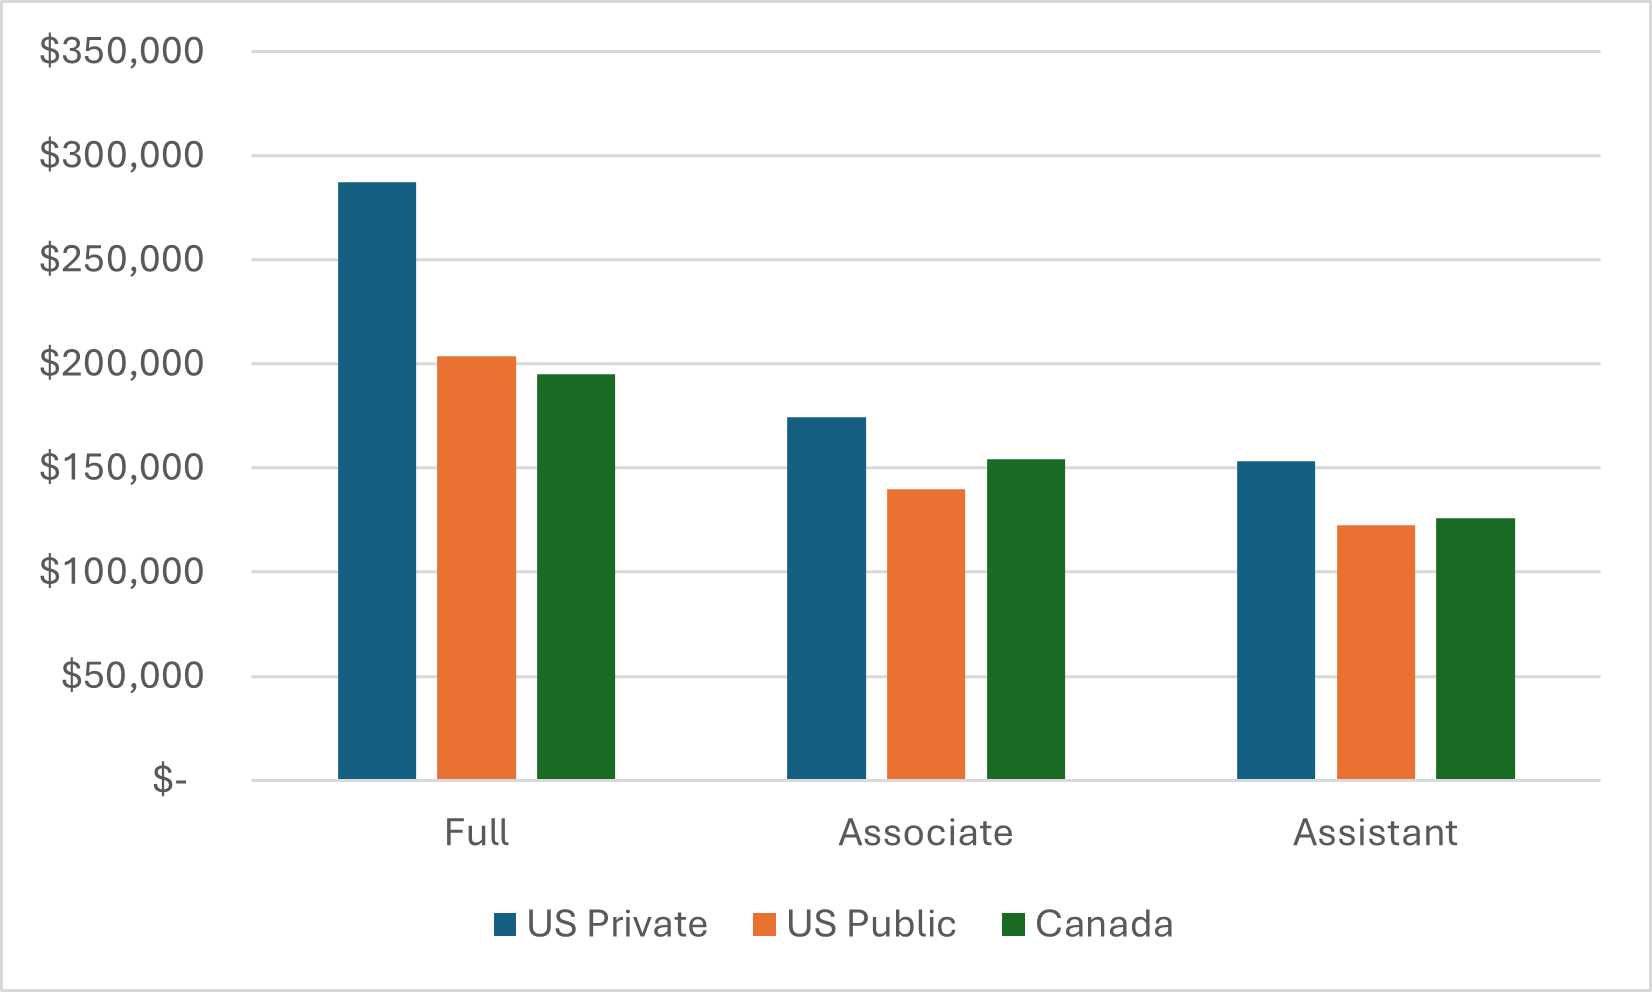
With that, I introduce to you Figures 4, 5, and 6 which compare salaries (in $C) at Canadian institutions by rank with those of US publics and private universities at the baccalaureate/undergraduate, master’s/comprehensive and doctoral/ U15 levels, respectively. What we find is that Canadian undergraduate institutions are pretty competitive with American institutions on salary and Canadian comprehensives blow American ones out of the water (though as noted above that’s probably because some of our comprehensives look more like doctoral institutions, where the pay seems to be higher). However, at the level of research universities—where about half of all Canadian academics teach and where the real war for scientific talent is fought—is where Canada runs into more of a problem. We can hold our own against US public institutions (though for how long that remains the case given current funding trends in the two countries is an open question) but suffer significantly in comparison to American private doctoral universities.
Figure 4: Average Full-time Faculty Salaries by Rank at Bachelor’s/Undergraduate Universities, 2022-23
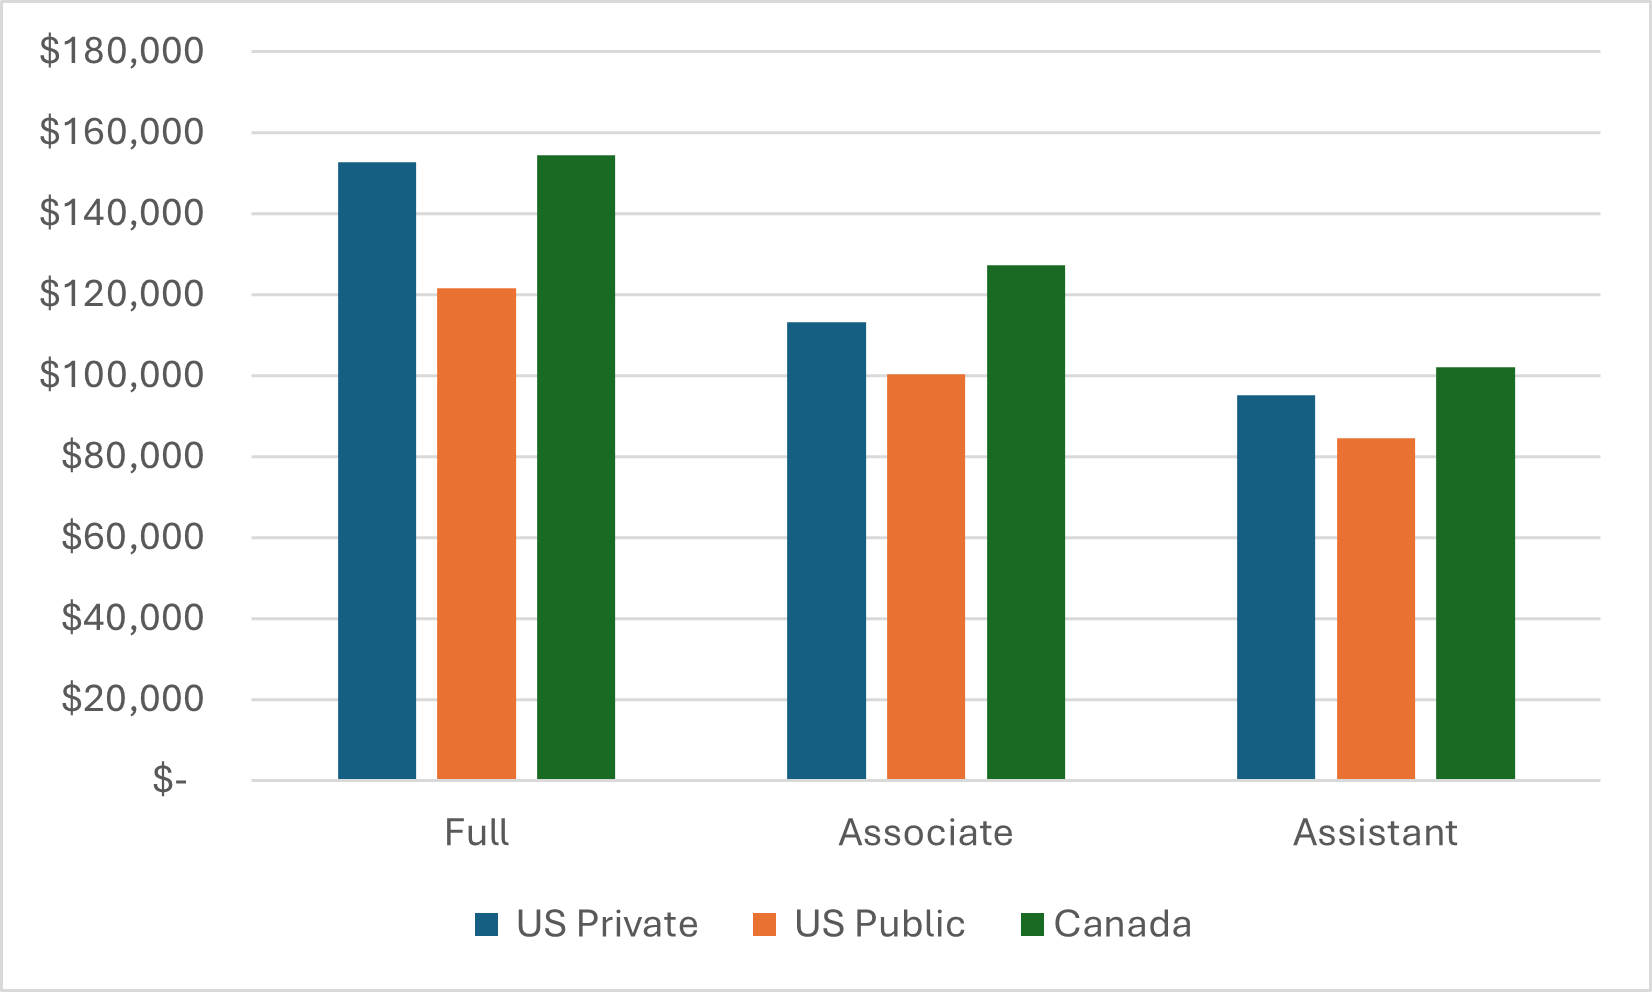
Figure 5: Average Full-time Faculty Salaries by Rank at Master’s/Comprehensive Universities, 2022-23
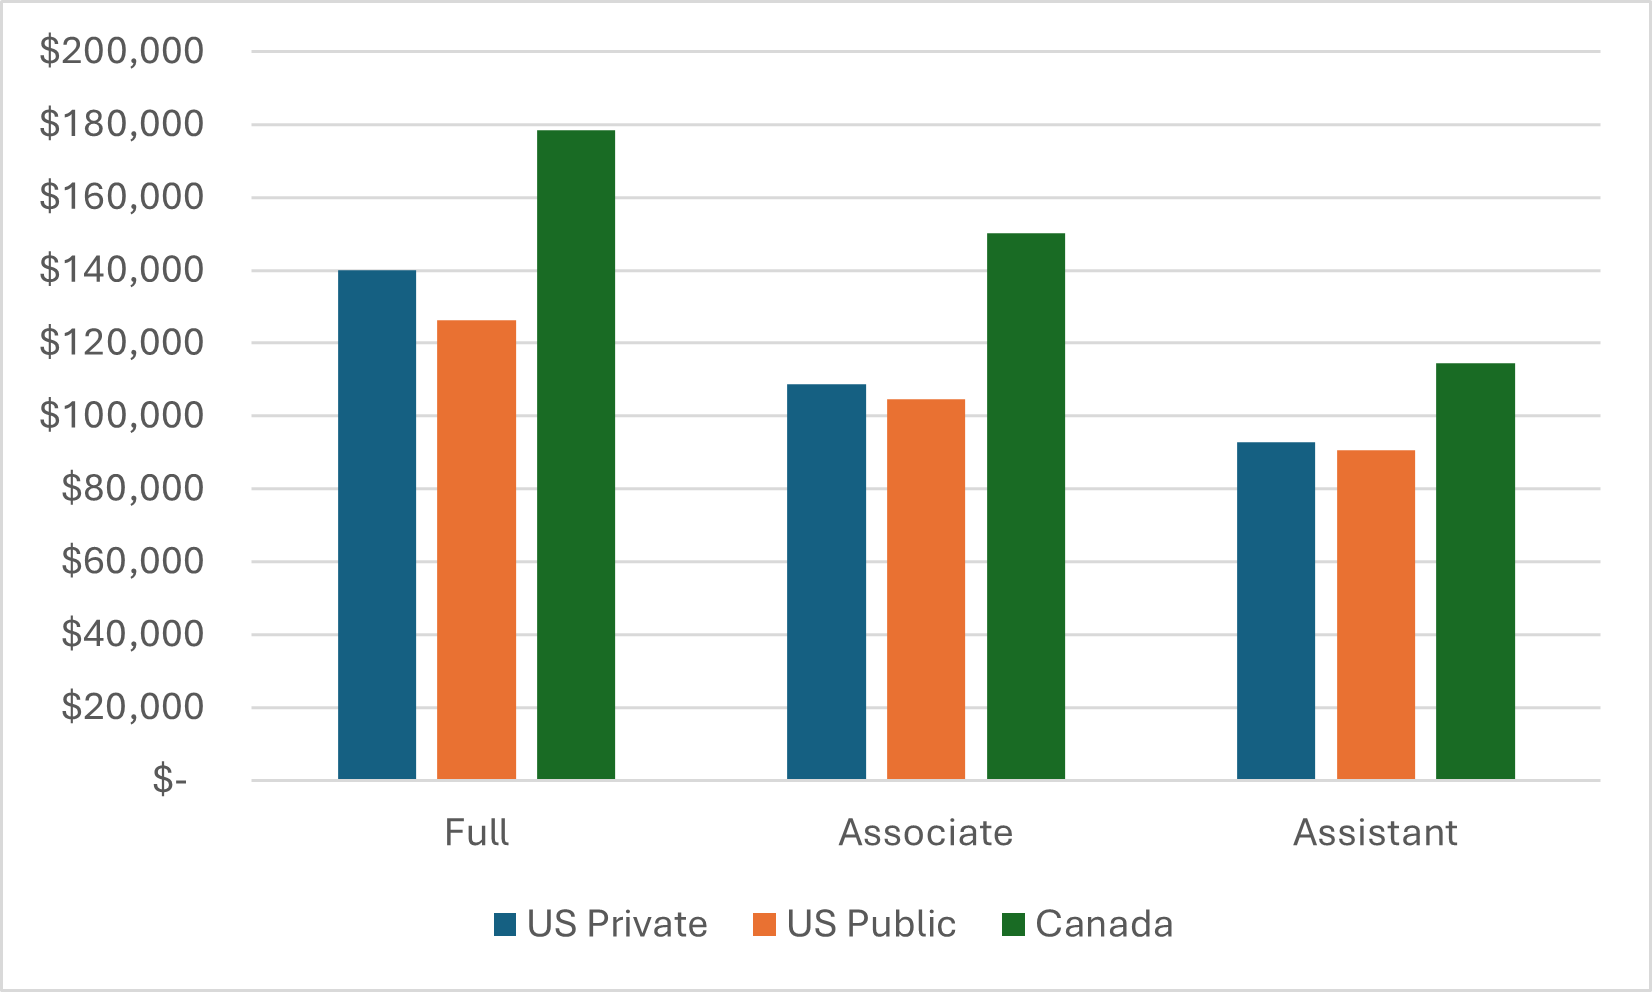
Figure 6: Average Full-time Faculty Salaries by Rank at Doctoral/ U15 Universities, 2022-23
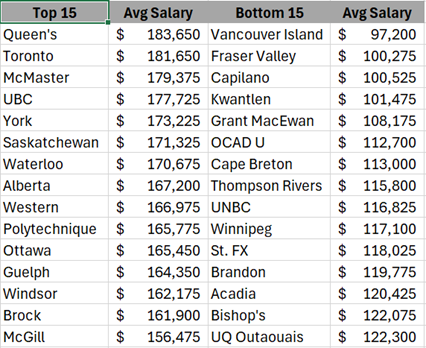
And finally, let’s just check in briefly on which Canadian institutions are at the top and bottom of the page grid. Table 1 shows the top and bottom 15 institutions for average pay across all ranks. You will note that the top institution on the list is Queen’s, and yes that definitely has something to do with its current financial predicament: it is one of the very few universities where average pay has gone up in real terms in the last two years, something which is likely due to a paucity of retirements (and hence a clustering of pay at the top end of the scale) rather than mass salary increases.
Ten of the top fifteen are U15 institutions, four are Ontario comprehensives, and the other one is Polytechnique, which has seen big salary growth in the last few years, possibly due to the cost of trying to keep up with acquiring Engineering talent. At the other end of the scale, all fifteen of the lowest-paying institutions are undergraduate-focused institutions, all of the four lowest-paying (and six of the bottom ten) being in British Columbia. The other nine in the bottom fifteen are a mixed bunch but include three of the four Maple League institutions. OCAD University is the only Ontario institution to make this list (note though that NSCAD, Emily Carr, and Alberta University of the Arts do not participate in this survey I am fairly sure all of them would be in this grouping if they did).
Table 1: Top- and Bottom-15 Institutions for Average Salary, 2020-2021
Enough for now. We’ll do this all again in 2026.


8 Responses
Where is Ucalgary in your salary scheme?
I don’t see most of the 5 research universities in BC listed here. Royal Roads, Simon Fraser, UNBC, University of Victoria,
any reason?
This is the U15 list. You’ll find an explanation on their site: https://u15.ca/about-us/our-members/
Many universities do research but only 15 are in this elite division, the Champions League if you like.
And that’s a problem. It’s part of the definition of a university to do research. If the U15 are labelling themselves as research institutions, then they’re denying the status of other (implicitly lesser) institutions, while working to create an American-style stratification of higher education.
If you mean Table 1, it is NOT U15. It is simply the top 15 Universities for average salary, and includes some non-U15 Universities like York, Guelph, Windsor and Brock (and Polytechnique) while it does not include Calgary (my own University), Manitoba, Dalhousie, Laval, and U. de Montréal all of which are in the U15.
Are the averages in the above table actual mean salaries, or median salaries? I ask because salaries are sometimes reported as medians, and it could be argued that this is more representative since salaries at the high end (research chairs and the like) can often be double those of a senior full professor.
Also, the CAUT almanac used to report salaries for all institutions, but these did not include medical ones. Are the ones reported here averages across all disciplines, or are the medical ones still kept out.
Finally, are these “rank” salaries or do they include research stipends, market supplements and other chicanery used to offer high salaries to perceived stars or people in certain fields, while keeping a lid on the salaries of most profs in arts and science?
Thanks for this, and enjoy your time off.
I think something we’d need to know is how much of the teaching is carried by members of the precariate — sessionals, lecturers, postdocs and grad students — and how much underpaying them allows for the handsome remuneration of faculty at research institutions on both sides of the border.
Secondly, it’s hard to tell, because you changed the scale on the last three charts (no doubt for good reasons), but it seems to me that Canadian faculty members get roughly the same pay whether at a comprehensive or at a U15 institution: the difference for full profs is within 10%; associates in either sort of institution average $150k; associates average $120k. Their American colleagues, on the other hand, take a significant hit to be in a non-doctoral institution.
This would seem to reflect the greater stratification of American institutes of higher learning, though the final table shows British Columbia fully embracing an American-style stratification, with Vancouver Island profs making a little more than half that of UBC faculty.
In any case, the princely sums bestowed on full professors in US privates — almost twice the salaries of associates — seems to indicate a star system and frankly, I don’t want to be working with any overpaid prima donnas. We’re good to be rid of it.
And that’s a problem. It’s part of the definition of a university to do research. If the U15 are labelling themselves as research institutions, then they’re denying the status of other (implicitly lesser) institutions, while working to create an American-style stratification of higher education.