


We haven’t looked at faculty salaries in awhile, so let’s do that.
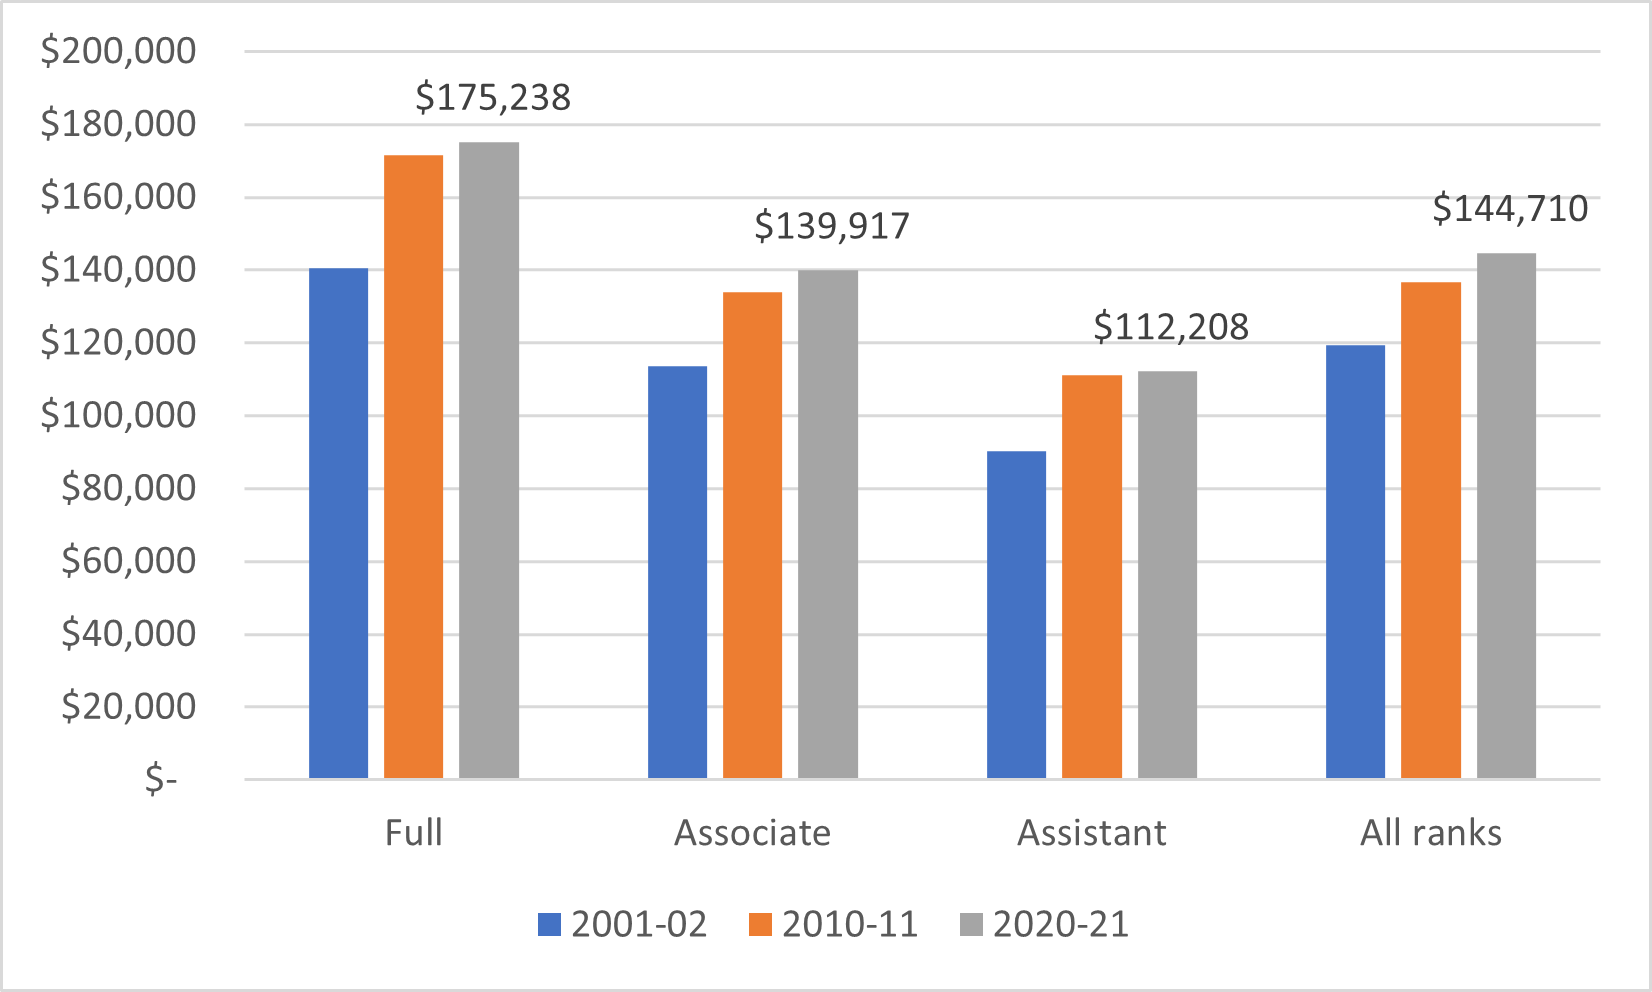
Getting a handle on recent faculty salary data is easy: it’s the one thing that Statscan does both rapidly and well in the higher education field. It may take them 30 months to produce student enrolment data, and they collect no data at all about college tuition or non-academic staff, but by gum they can process university salary data in under 12 months! (Yes, this does tell you quite a bit both about Statscan’s priorities and those of the institutions submitting data). Older data is harder to work with. Some of it is only available in pdfs at the institutional level which means a tremendous amount of tedious mucking about transferring data into excel, and for a few years during the Harper era, Statscan stopped collecting this data and institutions themselves collected it (though most of the Quebec and Maple League institutions chose not to participate, so the data from that period is a bit off). But because I once actually spent the time to do that data transformation for a couple of pre-2010 years, I can do some 20-year comparisons like the one in Figure 1, which shows that in real terms, faculty salaries are up by 20-25% since 2001, depending on what measure you choose to employ.
Figure 1: Average Full-time Faculty Salary by Rank, Canada, Selected Years, 2001-02 to 2020-21 in constant $2020
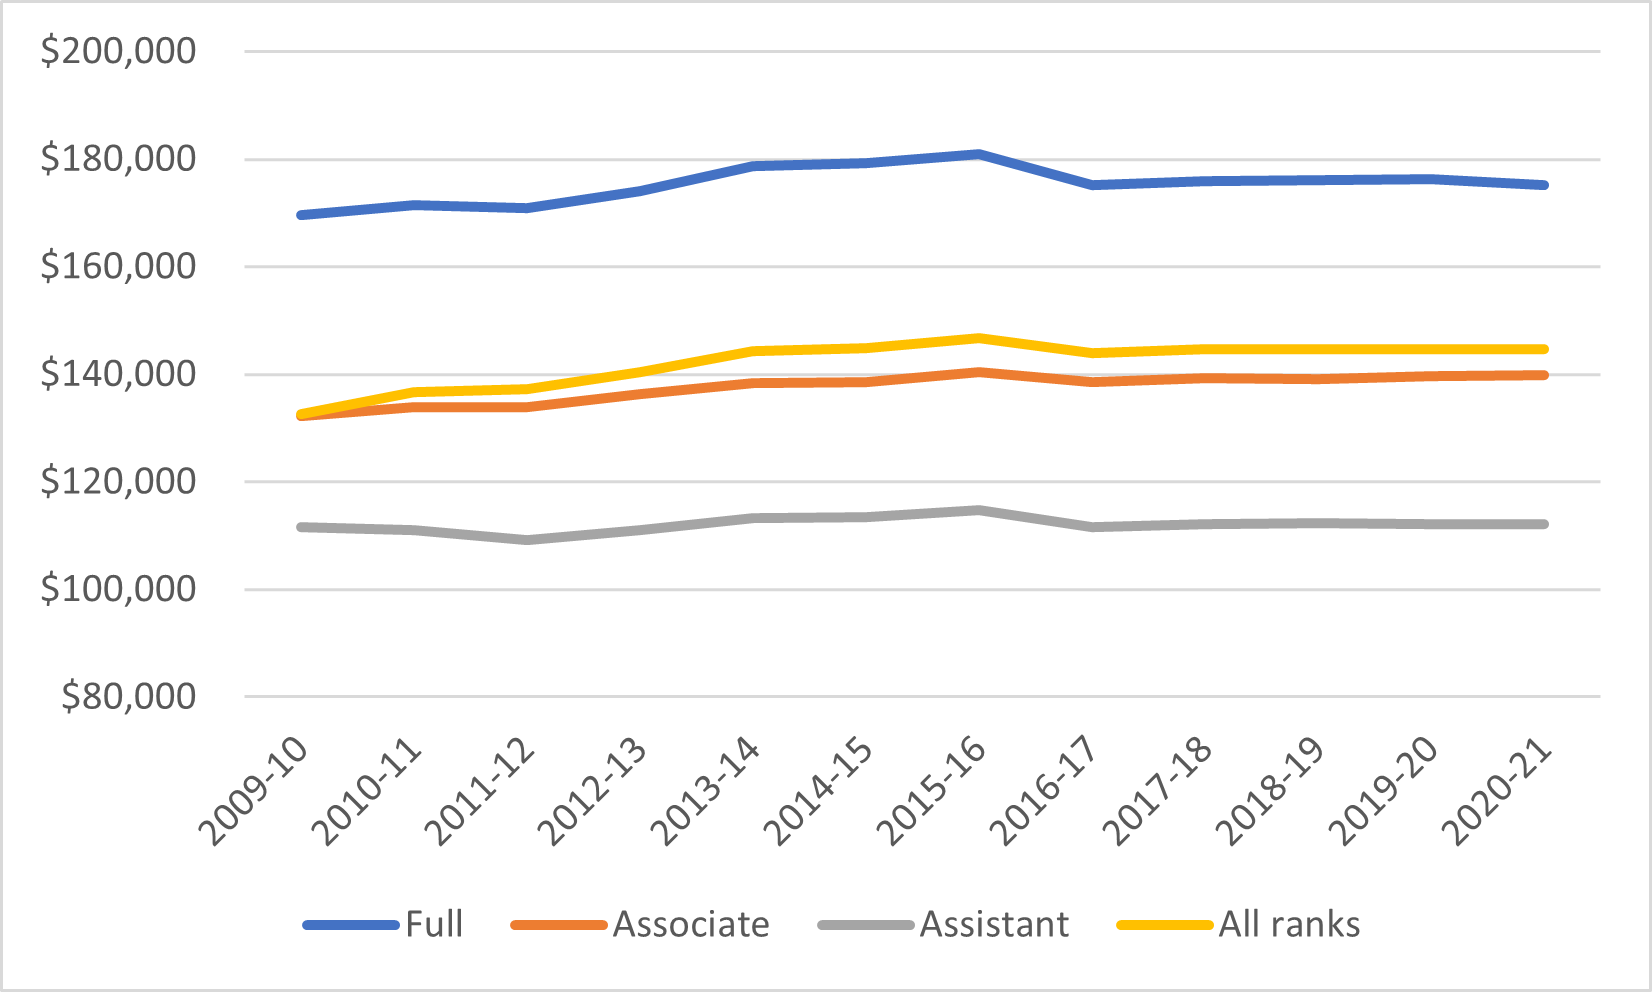
As I say, that’s one way to look at the data. Figure 2, which focuses just on the period for which we have complete data, is another. After inflation, in the past 11 years, professorial salaries have actually only increased from 1-9%, depending on the specific measure chosen (note that there is a bit of a bump in all salary lines between 2011 and 2016 – this is because, as noted earlier, Quebec and the Maple League are absent in those years, and since their pay levels are slightly lower than those in the rest of the country, their absence made the average rise and their return made it fall). Basically, whatever happened during the huge run-up in salaries in the noughts has been well and truly over for quite some time.
Figure 2: Average Full-time Faculty Salary by Rank, Canada, 2009-10 to 2020-21 in constant $2020
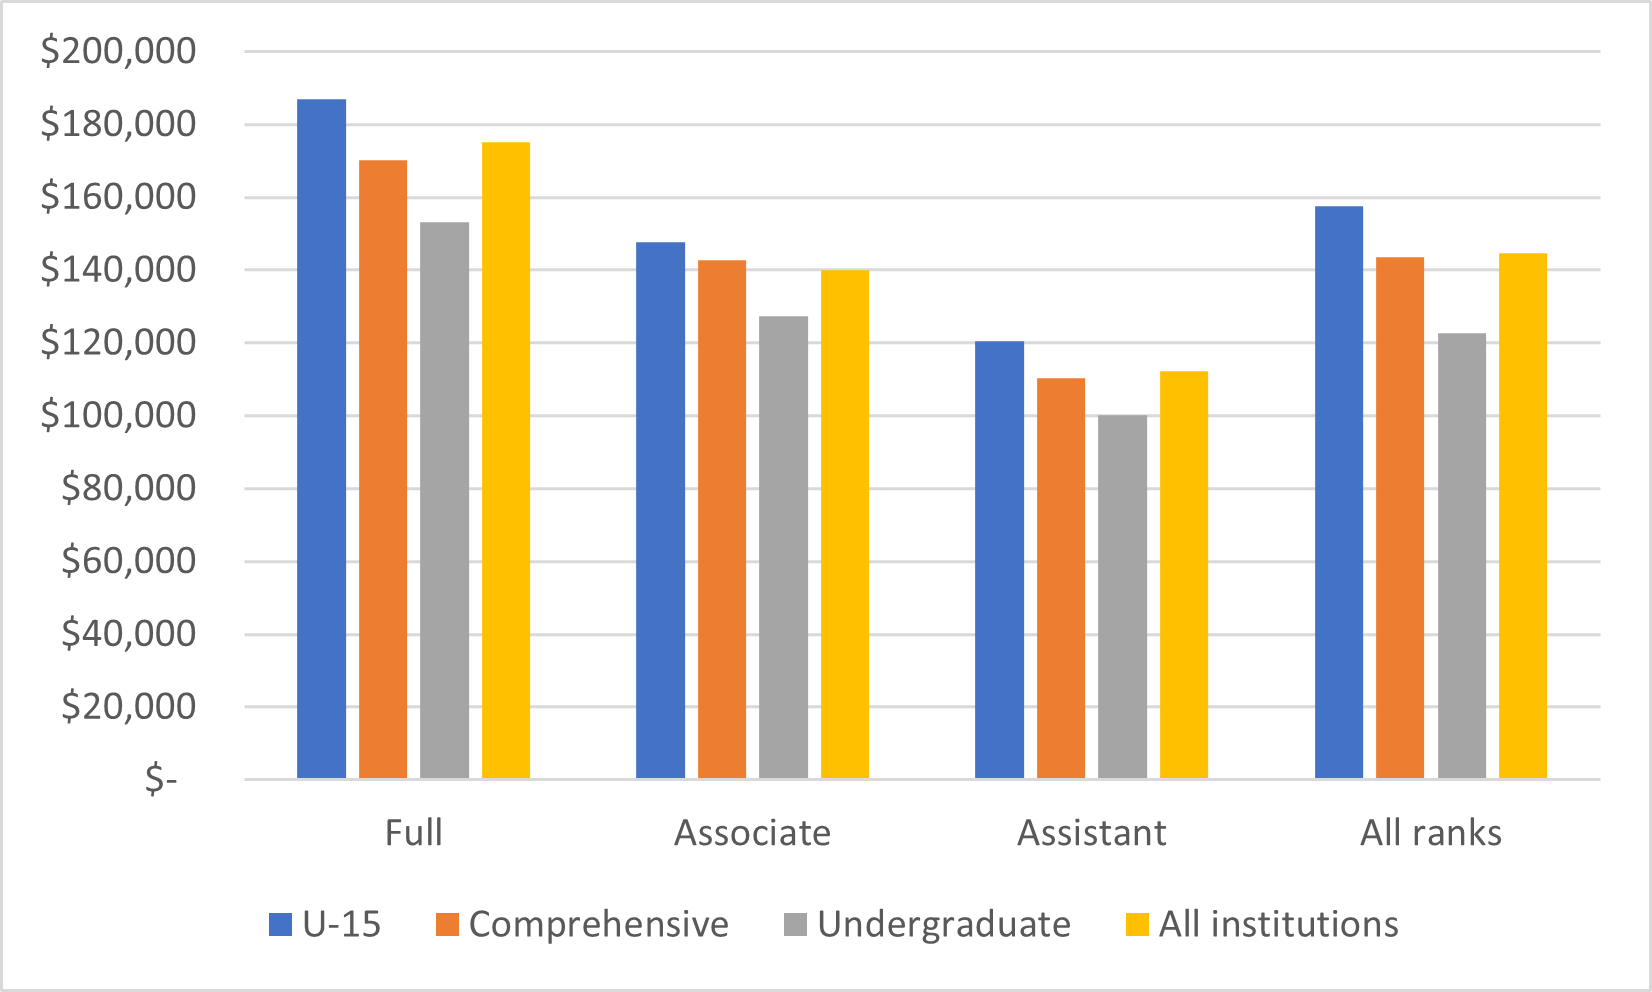
Of course, not all institutions have the same pay scales. On the whole, there is a pretty basic relationship between research-intensity and resources. Across all ranks, pay is almost 29% higher at U-15 institutions than it is at predominantly undergraduate institutions.
Figure 3: Average Faculty Salary by Rank and Type of Institution, Canada, 2020-21
This is the place where I usually throw in a quick comparison to the US, which is always fun. Just to recap how I do these: the American Association of University Professors publishes average salaries for Doctoral, Masters and Bachelor’s institutions, which I am going to take to be equivalent to U-15s, Comprehensives, and Undergraduate institutions in Canada (which is probably not exactly right, particularly for the comprehensives, but it’s the closest comparisons I can think of). I convert US salaries to Canadian dollars by using Statistics Canada estimates for purchasing power parity ($1C = $0.83US). And finally, not that US salaries are based on a 9-month school year (American profs are not salaried year-round); for doctoral universities only, I assume a summer income from research projects equal to 2 months of salary for the 69% of researchers at these institutions who hold external research grants.
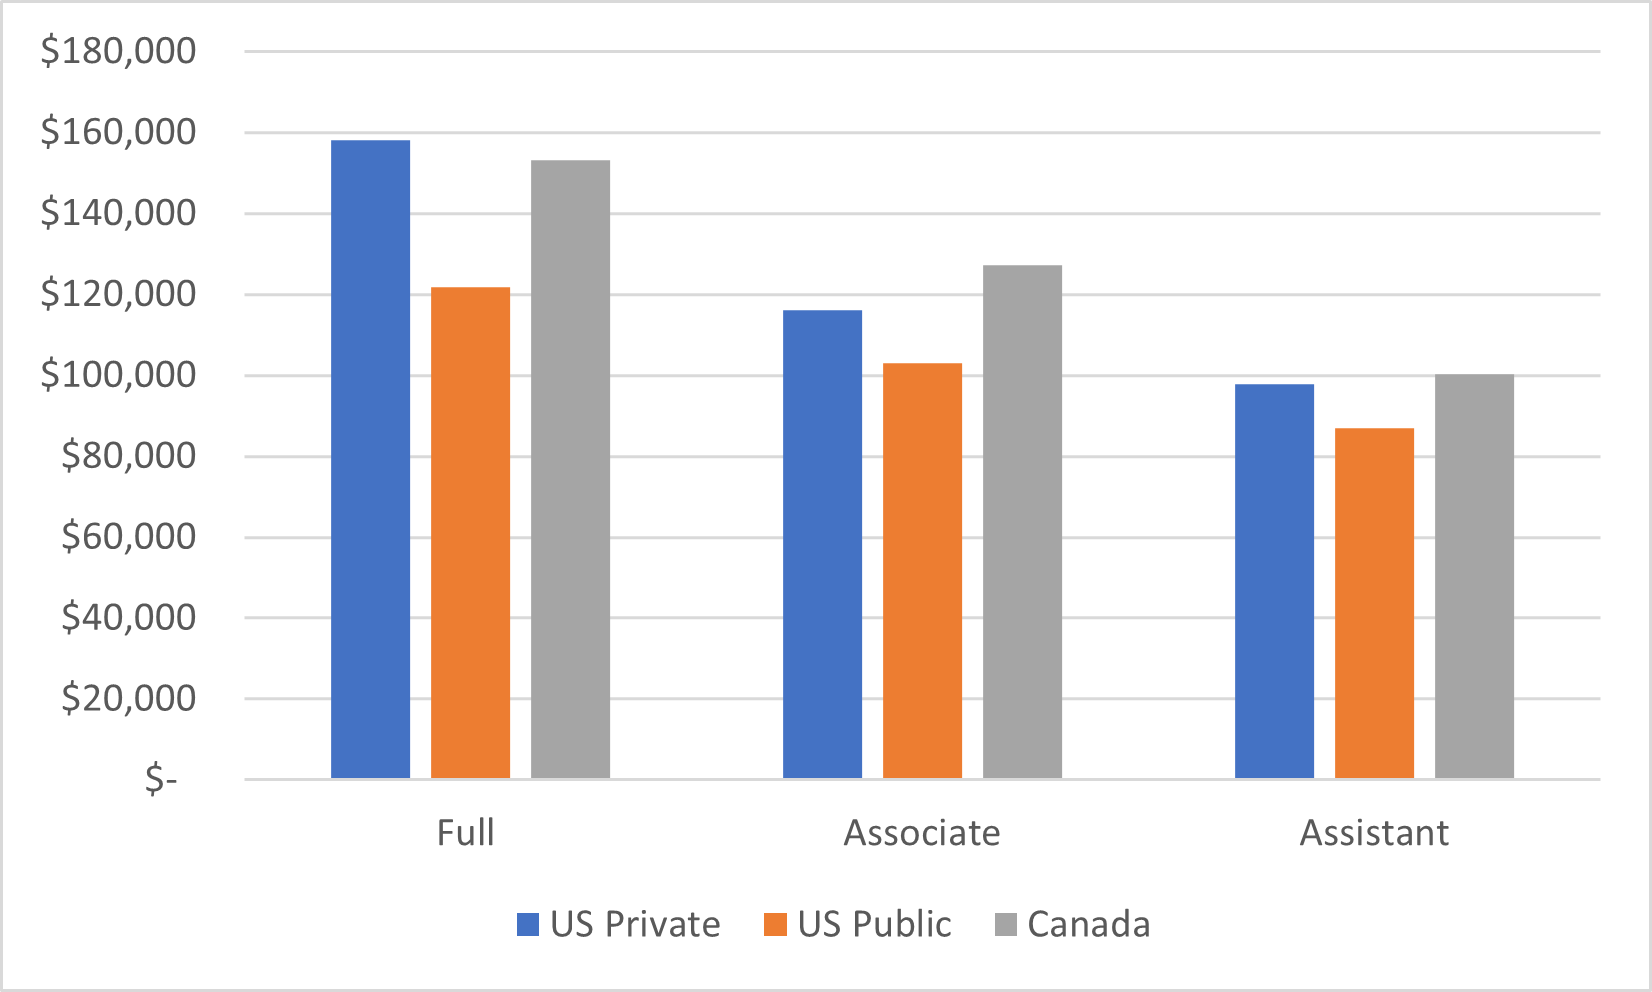
And with that, I introduce to you Figures 4, 5 and 6 which compare salaries (in $C) at Canadian institutions by rank with those of US publics and private universities at the Doctoral/U-15, Master’s/Comprehensive and Baccalaureate/Undergraduate levels, respectively. The U-15s are basically on par with US publics in terms of salary, but trail US privates by quite some distance, particularly at the level of full professors. On the flip side, Canadian universities tend to pay better both at undergraduate universities and especially in the Master’s/Comprehensive category.
Figure 4: Average Salary by Rank, Doctoral/U-15 Universities, 2020-21
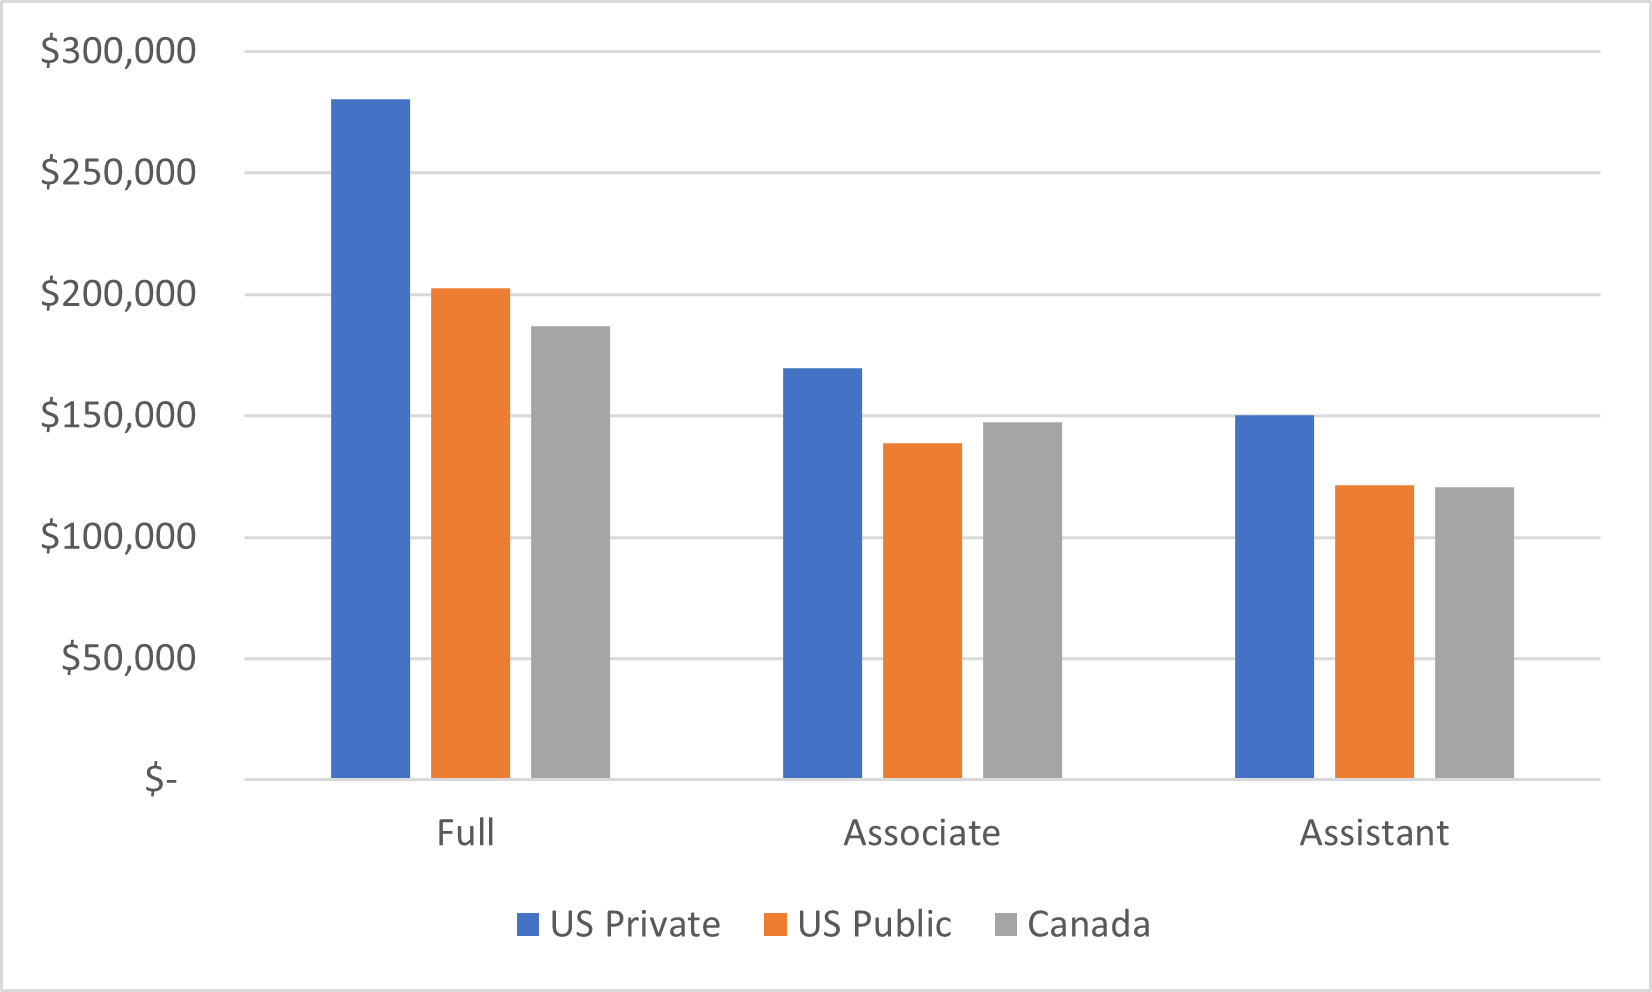
Figure 5: Average Salary by Rank, Masters/Comprehensive Universities, 2020-21
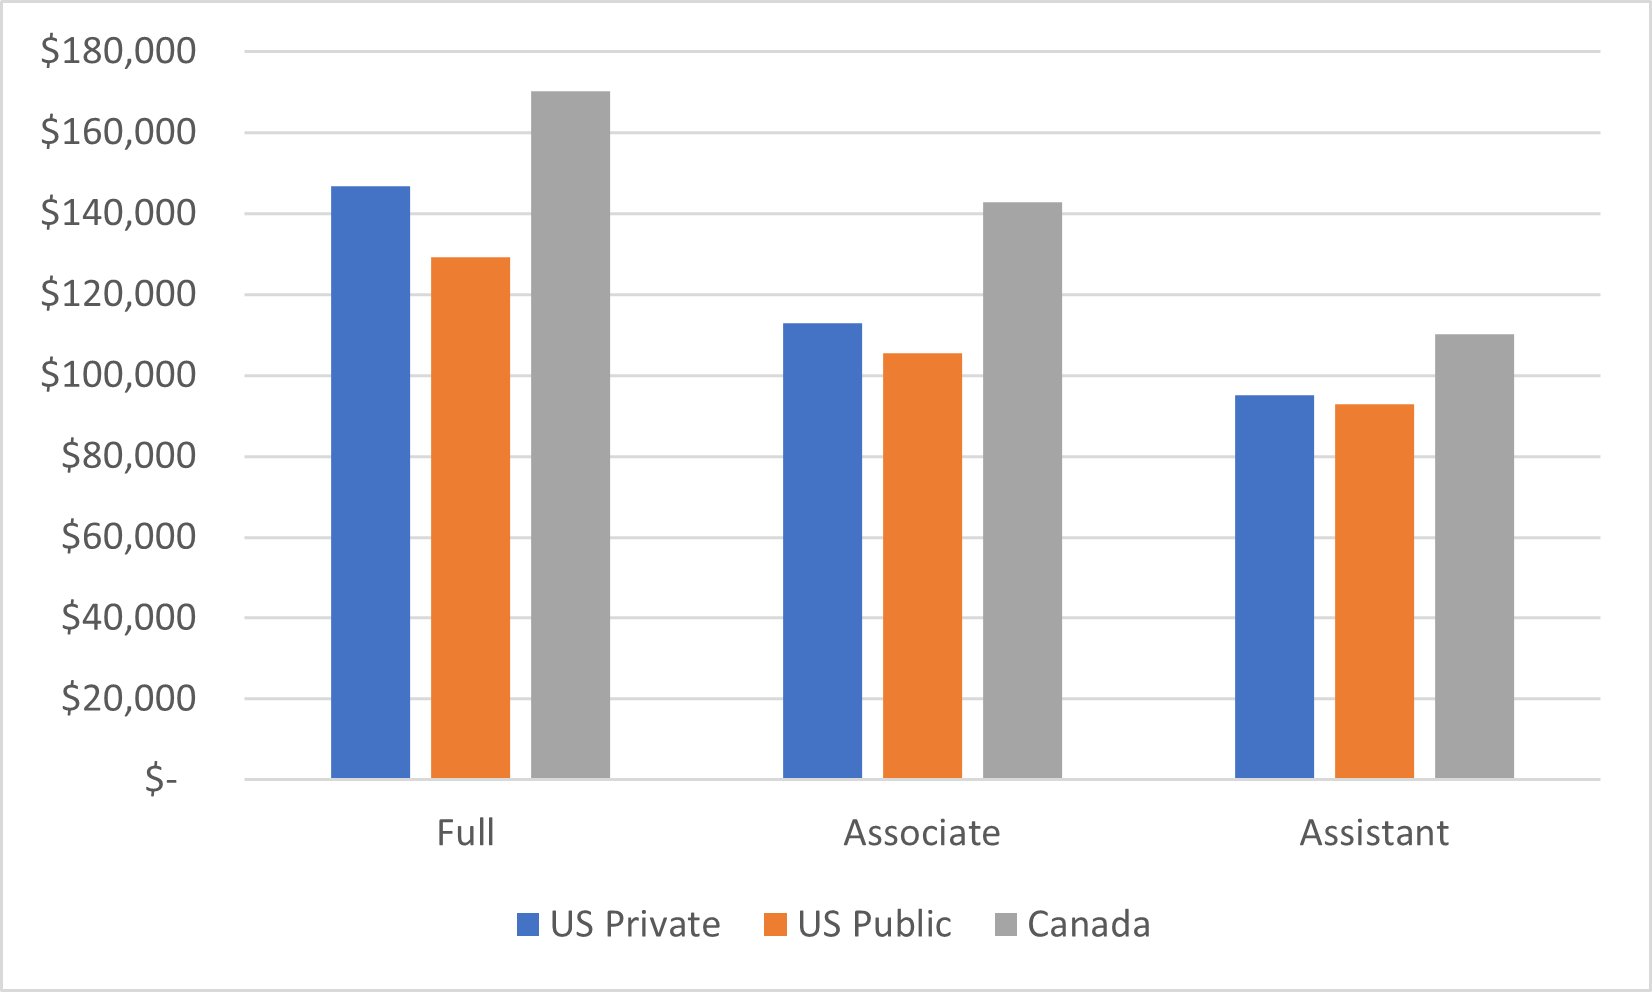
Figure 6: Average Salary by Rank, Baccalaureate/Undergraduate Universities, 2020-21
And finally, let’s just check in briefly on the institutions which pay the most/least. The table below show the top and bottom 15 institutions for average pay across all ranks. Nine of the top fifteen are U-15 institutions, five are Ontario comprehensives and the other one is Laurentian, which tried to become a comprehensive on the budget of an undergraduate university (mainly by trying to match the salary levels of other Ontario comprehensives). Meanwhile, all fifteen of the lowest-paying institutions are undergraduate-focused institutions, with all of the five lowest-paying being in British Columbia. The other ten in the bottom fifteen are a mixed bunch, but include three of the four Maple League institutions, and two Quebec institutions. OCAD University is the only Ontario institution to make this list (note: none of NSACD, Emily Carr or Alberta University of the Arts participate in this survey: I am fairly sure all of them would be in this grouping if they did).
Table 1: Top- and Bottom-15 Institutions for Average Salary, 2020-2021

Anyways, that’s probably enough salary stats to hold y’all for another couple of years. Let’s do this again in 2024.


One Response
As always, these data are meaningless as economic or financial information. They may be useful in faculty-administration bargaining, but providing, for example, an average salary for universities that only includes members of the faculty association are pretty much meaningless. Some universities have large numbers of sessional instructors who do a lot of the teaching, others do not. Throw them into the averages and I suspect you would get quite different results – and much lower numbers overall.