


The OECD’s annual Education at a Glance (EAG) report came out last week. It’s a One Thought tradition to go through this report in detail for the latest international comparisons on institutional income and participation rates, but I’m going to mostly forego that this year. That’s partially because I have a doozy of a piece coming out on finance in a week or two, but also because this year’s EAG contains some interesting special topics worth looking at, particularly with respect to vocational education.
Figure 1 shows the proportion of first-time entrants to tertiary education who end up in short-cycle programmes (“college programs” in Canadian terms). Canada is among the top tier of countries in this category, with just under 40% of all our students heading into these kinds of programs, or roughly twice the OECD average.
Figure 1: Share of first-time entrants to short-cycle programmes among all first-time tertiary entrants
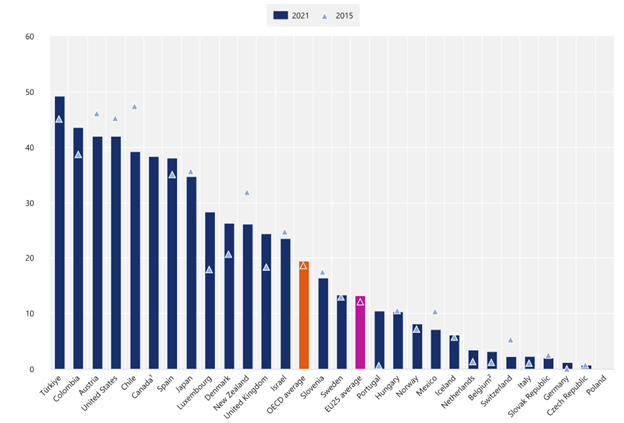
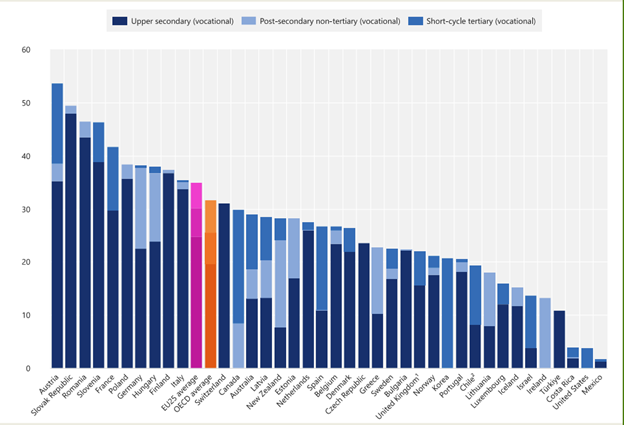
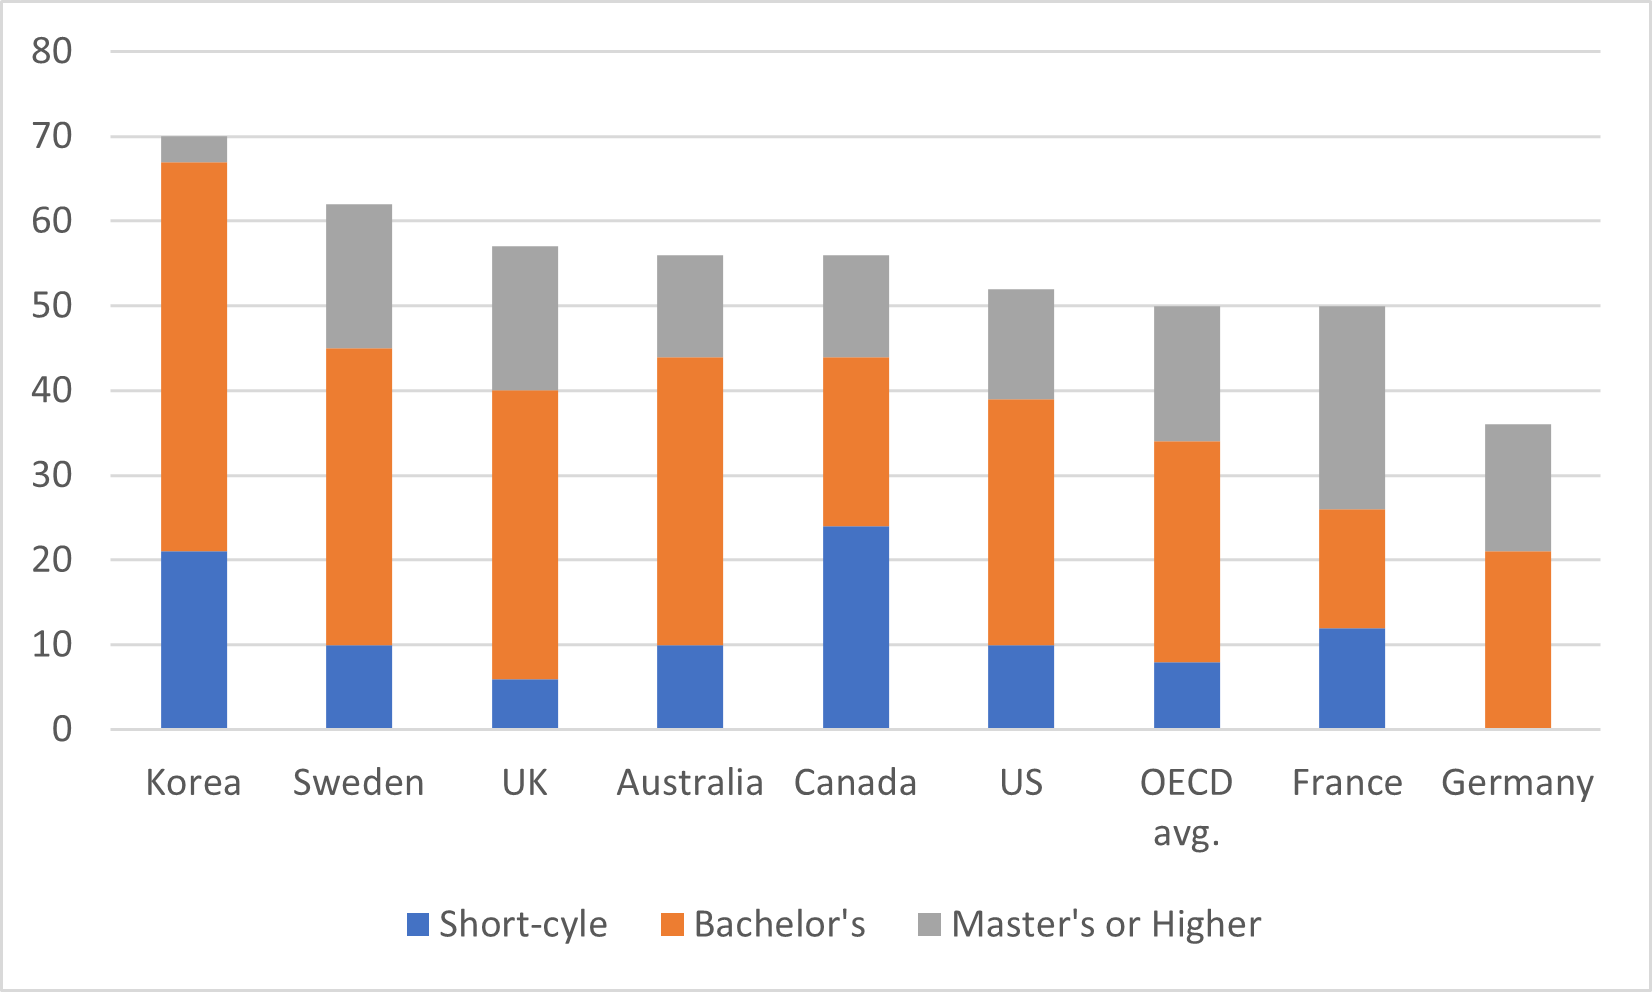
Figure 2 is a fantastic graph, which neatly shows how the real way in which the Canadian system is an outlier internationally (Canada is second to the right of the orange OECD average bar). The graph shows the share of 25–34-year-olds whose highest level of education has a vocational orientation, by level of educational attainment across various OECD countries. Now you have to be a little careful about this, because I am pretty sure not all countries use the same definition of “vocational orientation” (for instance, that US number is so low that it can’t be equivalent to what we use in Canada). But basically, the height of the bar tells you the percentage of 25-34 years olds whose highest credential is vocational and the colouring tells you what level that credential is. Canada is not at all unique with respect to the former – we’re close to the OECD country average. Where we are unique is that none of these people’s highest credential is earned at the secondary school level. All of it is either “post-secondary non-tertiary” or “short-cycle tertiary”: i.e., programming that occurs in our various college systems (for the six or seven of you who wish to nerd out about the difference between these terms, please see this blog post which attempts to explain this somewhat picayune distinction). There is no college system like the Canadian college system. We can argue a bit about whether more of what we teach in colleges ought to be taught in secondary schools, but we can’t argue about whether Canada has the world’s most extensive system of post-secondary vocational education, because it quite clearly does.
Figure 2: Share of 25-34 year-olds whose highest level of education has a vocational orientation, by level of educational attainment, 2021
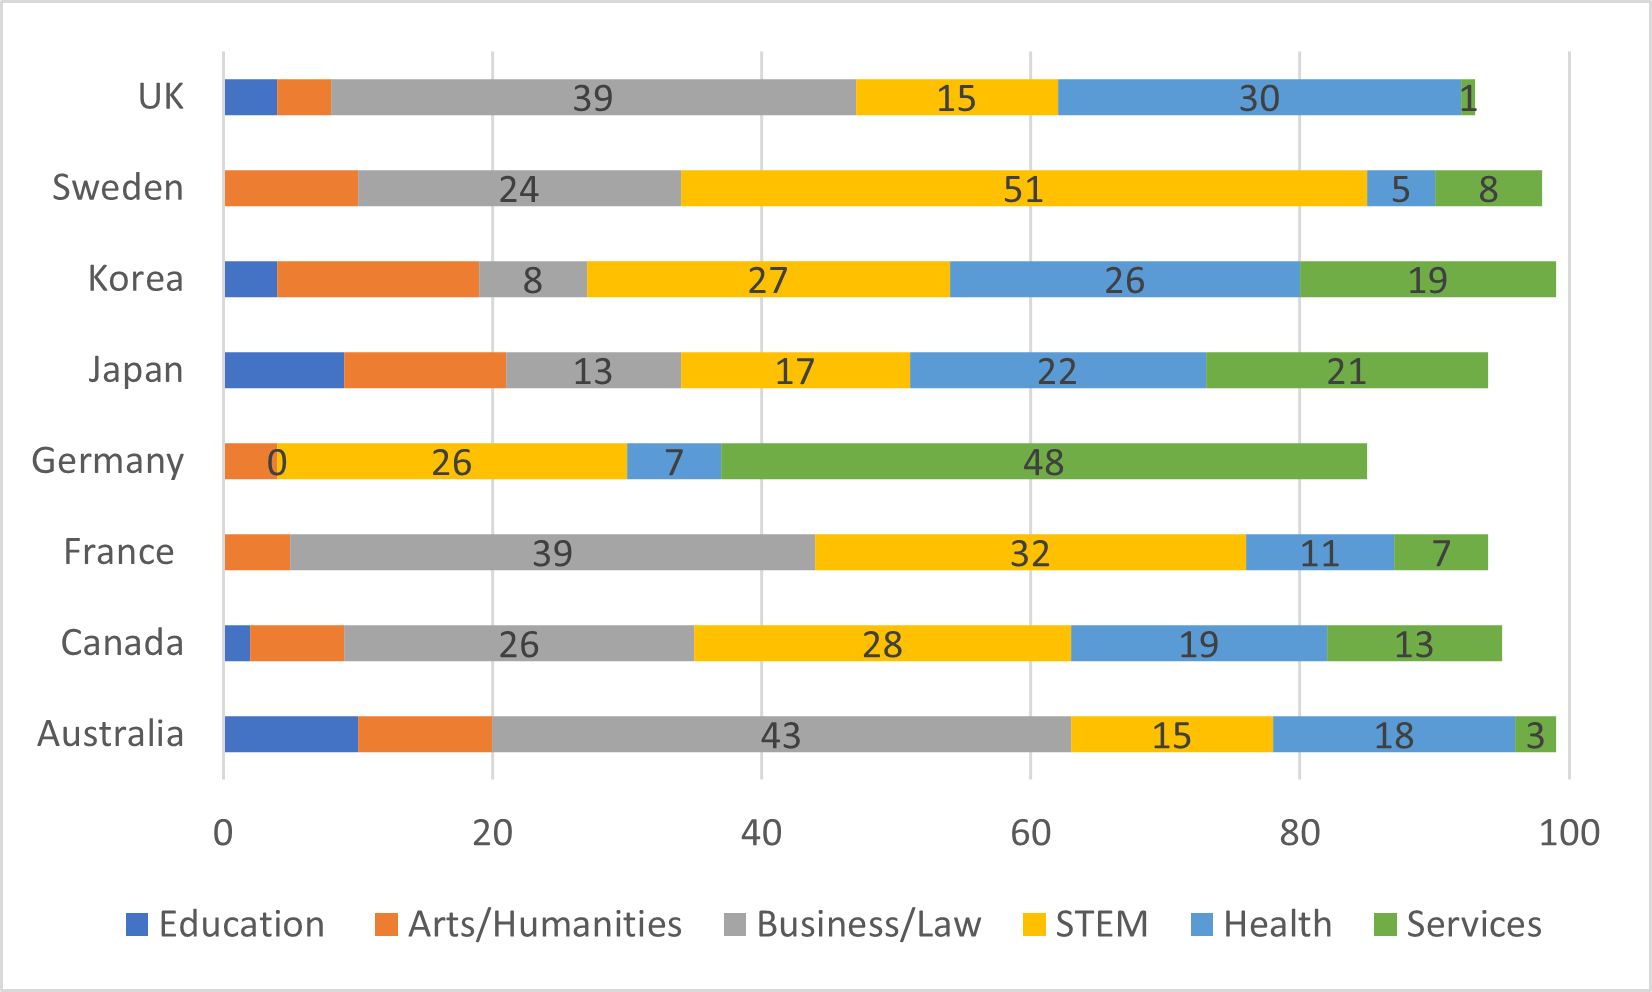
One of the most interesting data sets in this EAG concerns what subjects different national short-cycle systems teach. Figure 3 shows this for selected OECD countries. The key takeaway from these graphs is that different systems have very different foci. At a high level one can say that Canada’s system – like France’s and Japan’s – is more balanced across different fields of study than most.
Figure 3: Distribution of new entrants to short-cycle tertiary programmes, by field of study, Selected OECD Countries, 2021
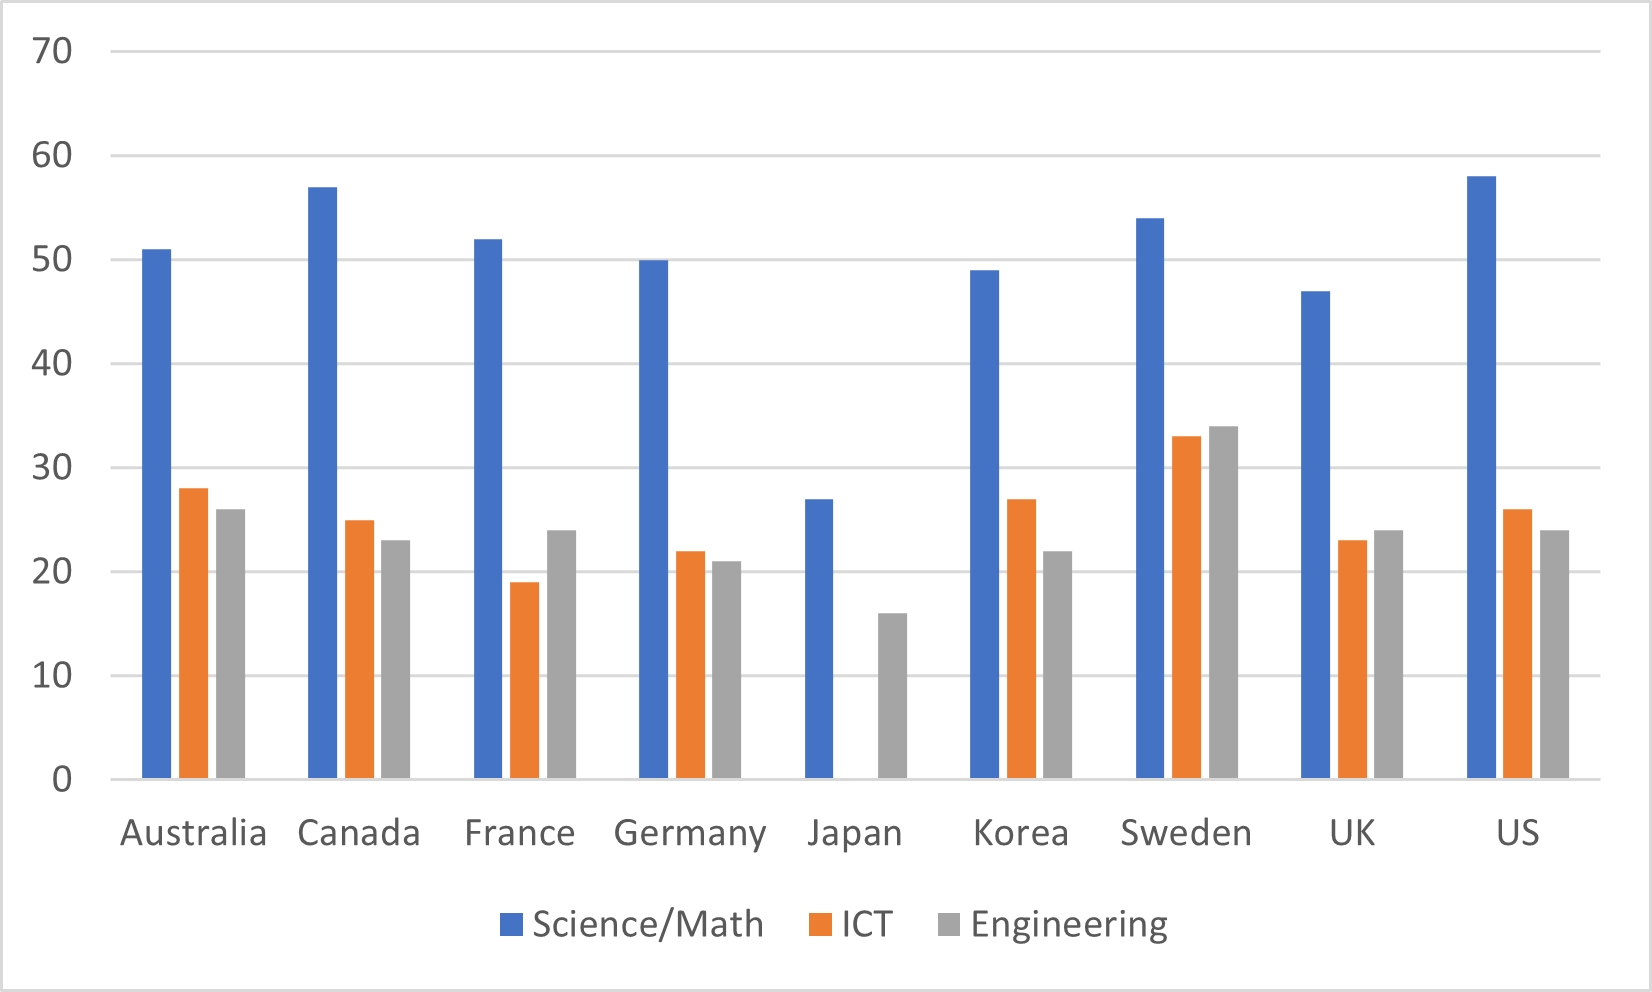
Moving towards the issue of gender equality by field of study, I was struck by the comparative international data on women in science in technology, and how similar the patterns are. Except for Japan, the percentage of new entrants to natural sciences, mathematics and science who are women is between 47 and 58 percent. But the percentages of new entrants in ICT and Engineering who are women is almost uniformly about half that – among the nine countries shown here, only Sweden manages to get the proportion of female entrants in either study area over 30%. This is decidedly un-good.
Figure 4: Percentage of New Entrants to Major STEM Fields Who are Female, Selected OECD Countries, 2021
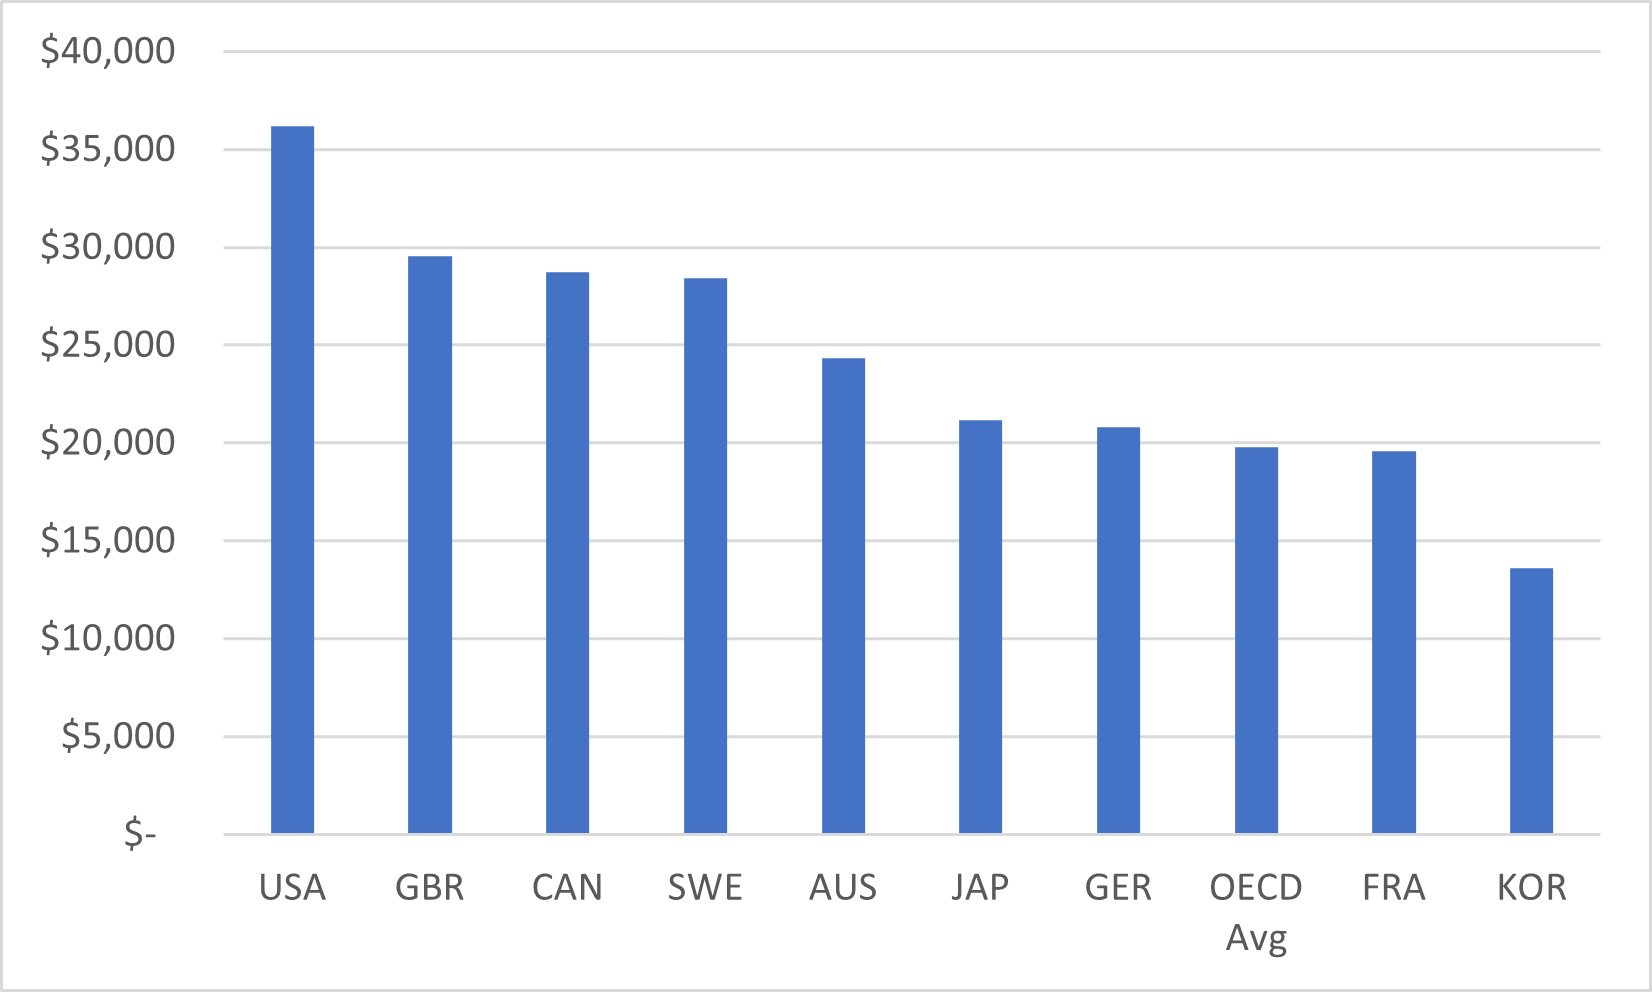
Still reading? OK, there’s time to show you some of the usual shtick about funding and attainment. Figure 5, which shows institutional expenditures per student, shows that Canadian universities are, despite everything, pretty well-resourced compared to universities in other countries.
Figure 5: Institutional Expenditures per Student, in USD, selected OECD countries, 2021
Finally, there is the question of attainment rates. This one has been hard to track the last few years because EAG perplexingly stopped publishing data on the 25–34-year-old age cohort in the last couple of years (they continued publishing data on 25-64 year olds, but that’s not particularly helpful to look at recent trends). Some of this data returned in this year’s book, so lets just take a quick look at what it shows, below in figure 6.
Figure 6: Tertiary Educational Attainment Levels, in Percent, of 25-34 year-olds, selected OECD Countries, 2021
This one is a little strange, because last time OECD showed this data, Canada was close to Korea whilst now it is closer to the OECD average. Given that there has been no rapid loss of graduates in the past few years, it seems likely that there has been some kind of change in the way Statistics Canada (and perhaps other countries as well) report data to the OECD.
Anyways, there’s your annual update. Enjoy.


One Response
Note that Germany doesn’t have any short cycle higher education; it doesn’t have any post secondary education institution whose highest programs are mostly below bachelors. In contrast Austria has Berufsbildende höhere Schulen (BHS) (college for higher vocational education), and 15% of Austrians aged 25-34 highest qualification is short cycle tertiary: Table A1.3. Educational attainment of 25-34 year-olds, by programme orientation (2022), page 52.