It’s that time of year when literally everyone is releasing data and reports for the back-to-school period (SELF-PROMOTION KLAXON: look for my new paper on Performance-Based Funding of post-secondary education, out from the CD Howe Institute Tuesday next week). Over the next couple of days, we’ll be doing a deep dive on Canadian university finances; today, though, I wanted to go through some of the highlights of this year’s Education at a Glance from the OECD, which dropped yesterday morning and which you can read for free here.
This year’s edition has some interesting information specifically on tertiary education, particularly with respect to admissions systems, differences in outcomes between doctoral and master’s graduates, and on completion rates. Oddly, Canada does not appear to have participated in most of these, even though the census and the LFS provide clear data on graduate-level information. Bizarrely, we also only provided partial data for completion rates. These sections are worth reading—especially the one on admissions (start on page 446)—though I won’t go into detail on them because I’ll be tempted to just start ranting about Statscan and you’ve all probably had enough of that. (Though if you want some more, this should do the trick.)
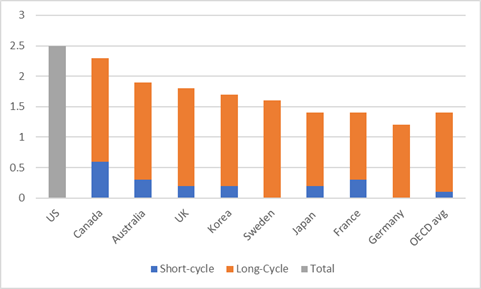
Other highlights of the report include the fact that, for another year, Canada is among the world leaders in aggregate spending on postsecondary education as a percentage of the economy (2.3% total, split roughly 50-50 between public and private). We are also by-and-far the largest spenders by percentage on “short-cycle tertiary” (i.e., colleges and polytechnics), six times the OECD-wide average of 0.1% of GDP. In fact, not only do we spend the most in this section, we also have among the highest enrolments in the sector, making short-cycle tertiary education probably the defining feature of the Canadian higher education “system”. With such a large sector providing clear pathways into a range of middle-income professions, it is also a major part of our success in combatting the kinds of extreme income inequality that we see in the US or in the UK.
Figure 1: Total Expenditures on Tertiary Education as a Percentage of Gross Domestic Product, by length of program, selected OECD countries, 2016

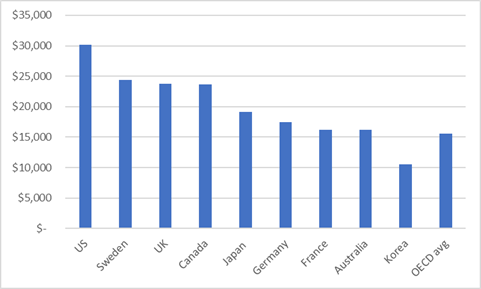
Some of my regular Twitter interlocutors (hi Gavin!) get upset with me for saying, “Canada spends a lot on education” on the basis of graphs like Figure 1. They say that you can only really measure this level of expenditure by looking at dollars-per-student. This is what Figure 2 portrays:
Figure 2: Total expenditures (public & private) per FTE Tertiary Education Student, in $US PPP, 2016

Evidently, this reveals a slightly different story. The US looks better on this measure because its per-capita GDP is bigger than everyone else’s. Korea looks worse, partly because it has a smaller per-capita GDP, and also because proportionately it has a lot more students than everyone else and therefore has to spread the money more thinly. Conversely, Sweden and Germany look better because proportionately they educate somewhat fewer students than everyone else and so divide the funds between fewer students. One may be tempted to say that based on this measure, Canada does not look quite as good.
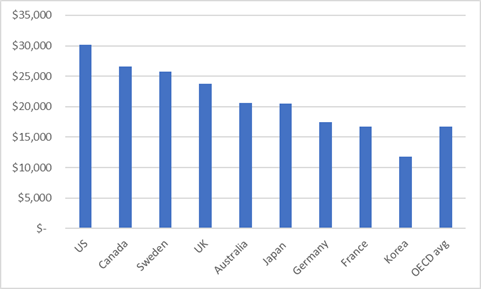
But, wait! Figure 2 shows the total expenditures across both short- and long-cycle education. Since the latter is usually more expensive than the former, we might presume that Canada’s aggregate ranking in this regard suffers because it educates so many students in colleges. And, in fact, this is more-or-less the case (see Figure 3).
Figure 3 – Total expenditures (public & private) per FTE Long-Cycle/University Student, in $US PPP, 2016

A couple of things to note here: the US figure is probably somewhat understated because they choose not to distinguish between long-and short-cycle expenditure (officially, Americans believe that everyone in 2-year colleges studying for associates degrees might in fact be going on for a 4-year degree, which is lunacy but whatever). That means community colleges are counted in the data for this figure; logically, if you removed them, it would raise the average. Australia and Canada both move up significantly in this calculation—in our case up to a clear #2 among major OECD countries in expenditures per student—while the rest stay pretty consistent. This is mainly because other countries’ short-cycle systems are either small or non-existent and so don’t affect the average much.
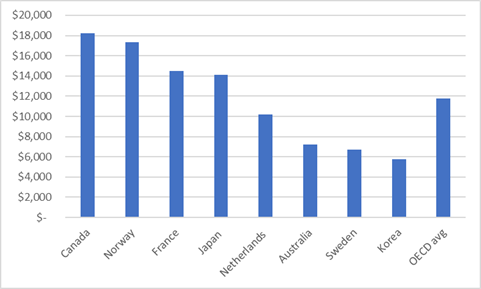
Now, for fun, let’s look at the same data, but just for short-cycle/college programs.
Figure 4 – Total expenditures (public & private) per FTE Short-Cycle/College Student, in $US PPP, 2016

A couple of countries we looked at earlier have had to come off the chart here: the US because it doesn’t report community colleges separately, Germany because they have no short-cycle institutions (apprenticeships are considered part of the secondary system, not the post-secondary system), and the UK… well actually I don’t understand why the UK appears not to have short-cycle programs according to OECD definitions because their FE sector looks pretty short-cycle to me. As such, they have been removed and instead I added Norway and the Netherlands. The result: Canada comes out top! Based on this measure, we have *the* best-funded short-cycle/community college system among major developed countries, along with the #2 best-funded university system.
This is a good thing, of course. It speaks to our national commitment to education. But—and I know I bang on about this every year, but it’s true—it also raises genuine questions about why everyone claims to be underfunded. Relative to whom, exactly? And why do other countries seem to get results similar to ours with less money?
Data is like a set of mirrors. We should look into them sometimes and ask hard questions.

 Tweet this post

One big difference, at least relative to European post-secondary institutions, is that in Europe most post-secondary students live at home and commute to school. As a result there isn’t the same need for residential infrastructure at European institutions as we have in Canada.
Here’s a hard question: is one of these things not like the others? Even the most densely populated parts of Canada have fairly low population densities by European or Asian standards, so one might argue that running an OECD-standard PSE system in a country with Canada’s particular combination of geography and demographics would be intrinsically more expensive than otherwise, essentially for (relative) lack of economies of scale.
-When people (as opposed to instutitions) say colleges are underfunded, my impression is that they mean the government portion of the funding is too low.
-What percentage of college income in Canada comes from foreign students?
-How do Ontario’s colleges compare here in terms of overall funding and government funding?
Only three “!”
Such restraint.
But in “the market” don’t 2-year college and B.Sc/B.A graduates come out to similar band salaries anyway?
Would differing social-connections coming from attendance at 2-year colleges, 4 year unis make a difference if looking at StatsCan Household (family) incomes?