


There has been a lot of chat over the past few days about a paper by three American scholars (Michael Park, Erin Leahey and Russell Funk) published in Nature about the declining rate of innovation in academic science (available here). The paper is interesting, but the very loud whining that has stemmed from it (see here and here but it was way worse on science twitter, trust me) is mostly pretty nonsensical. Let me break it down for you.
The paper tries to measure what it calls “disruptiveness” in academic research. To do this, it creates something called a “CD Index”. I’ll let the authors explain how this measure is constructed.
Some contributions improve existing streams of knowledge, and therefore consolidate the status quo. Kohn and Sham (1965), a Nobel-winning paper used established theorems to develop a method for calculating the structure of electrons, which cemented the value of previous research. Second, some contributions disrupt existing knowledge, rendering it obsolete, and propelling science and technology in new directions. Watson and Crick (1953), also a Nobel winner, introduced a model of the structure of DNA that superseded previous approaches (for example, Pauling’s triple helix). Kohn and Sham and Watson and Crick were both important, but their implications for scientific and technological change were different.
The intuition is that if a paper or patent is disruptive, the subsequent work that cites it is less likely to also cite its predecessors; for future researchers, the ideas that went into its production are less relevant (for example, Pauling’s triple helix). If a paper or patent is consolidating, subsequent work that cites it is also more likely to cite its predecessors; for future researchers, the knowledge upon which the work builds is still (and perhaps more) relevant (for example, the theorems Kohn and Sham used). The CD index ranges from −1 (consolidating) to 1 (disruptive). We measure the CD index five years after the year of each paper’s publication (indicated by CD5). For example, Watson and Crick and Kohn and Sham both received over a hundred citations within five years of being published. However, the Kohn and Sham paper has a CD5 of −0.22 (indicating consolidation), whereas the Watson and Crick paper has a CD5 of 0.62 (indicating disruption)
So, a disruptive paper is one which incites a lot of discussion about itself to the exclusion of previous papers in the field. That’s an operable definition, but I am not sure how useful it is as a representation of the state of scientific fields. As the authors themselves note, it’s not a measure of the quality of the science involved (papers with both positive and negative scores can be Nobel-worthy). And, in the social sciences like political science and economics (I’m going to confine myself here to fields I know something about to avoid making embarrassing errors), “consolidation” papers are typically how theory advances: for instance, someone makes a claim/promotes a theory (often based on American data) and then others peck away at it to see if the claim is indeed universal and if not, why not. I can see why one might want to claim that these are two different types of papers, but it’s not obvious to me that one is inherently more useful than the other.
Anyways, thanks to the miracle of citation databases, the authors were able to automatically generate a CD score for millions of scientific papers published since World War II (45 million, to be precise, though it’s not obvious to me how inclusive this is of the scientific universe or how the lines were drawn). And what they find is encapsulated in the following graph:
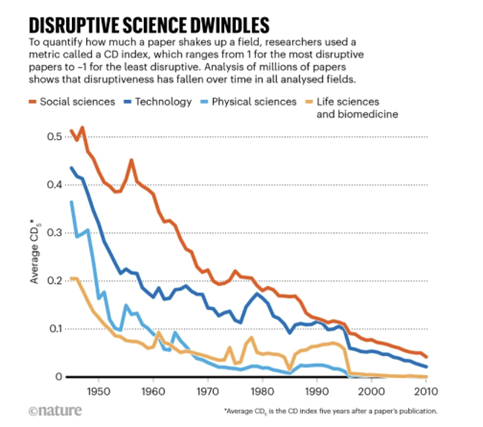
Now, we must be careful here in distinguishing what the authors say and how others have interpreted the article, and in particular this graph. Strictly speaking, what the authors are saying is that the proportion of papers which can be defined as “disruptive” has fallen, and that this fall has occurred across all academic fields. And that’s true. But what has people freaked out is the (IMHO deeply misleading) graph, which shows disruptive research has fallen to zero in life and physical sciences. Cue the various freak-out: science is paralyzed, risky research being obliterated, technology is stalling, economic growth in freefall, etc. The thing is, if you read the text above the graph, you’ll realize the scale isn’t 0 to 1, it’s -1 to 1. So, a score of zero just means that on average there is a pretty rough balance between disruptive and consolidating papers, not that disruptive papers have disappeared.
Furthermore, no one really seems to have looked at the x-axis and noticed that in all the scientific fields, fully half of the fall documented here happened before Sputnik was launched (i.e., over 65 years ago). So, all the commentary blaming such decline as there has been on intellectual conservatism in granting agencies and universities strikes me as historically illiterate. Plus, recall that these measures are scoring the average of all papers by year, not the absolute amount. If the average paper in the physical sciences has dropped in disruptiveness from +0.05 to 0 in the space of the last fifty years, but the absolute number of papers has risen eightfold (assuming an average annual growth of 4%) there is undoubtedly a massive increase in the total number of disruptive papers being produced.
Put all that together and it all sounds a lot less scary, right?
Now, I don’t mean to be dismissive here about the slowing of technological progress. There are a lot of questions to answer about why technologies developed between 1880 and 1950 still dominate our daily life to the extent they do and scholars are asking some interesting questions about this (see, for instance, Bloom et al’s Are Ideas Getting Harder to Find?). But the idea that the problem lies in academic science is, at best, unproven.


4 Responses
This analysis is exactly right, in my opinion. The misleading nature of the graph is well spotted. Perhaps the paper is an experiment to gauge how easily scientists are misled by statistics.
Ooof, now that I’m on Mastodon with a much smaller network than I had on Twitter I missed this one. But the graph tells me they needed a statistician or literally anyone from the social sciences on their team. Looks like an inverse graph of academic articles per year by discipline to me, and I’m sure if I looked at the data it would pretty well show that. It’s the wrong kind of graph to show their information and there are better ways of comparing innovative disruptions by year than comparing it to the total number of papers published in that year. I really like their idea of using “when people stop citing the papers from before this one” as the measurement though. I think that’s got some interesting potential.
Never worry that the topic of the demise of scientific process/ideas/disruption will exhaust the pearl clutchers. John Maddox (Managing editor of Nature during the roaring 70’s) claimed he was retiring because all of the major scientific discoveries had been made. Perhaps as we age, our capacity to accept there is a lot more yet to know becomes limiting. Naivety is the only protection against such arrogance.
What strikes me immediately is the discontinuity around 1996-97, in which “disruptiveness” seems to have gone down really quickly in several fields. Big jumps like that beg for an explanation — which I would suspect has to do with a change in a citation index, in turn throwing the whole methodology into question.
I would also like to see the distribution of “disruptiveness” — averages can be misleading. Is it that there are more junky papers out there? Or is the number of “disruptive” papers per working scientist really going down?
The authors seem not to address review articles — which, by their nature, consolidate rather than disrupt, and yet are highly cited. Most of the “highest impact” journals publish reviews only. Was this accounted for?