So, as noted yesterday, the OECD’s Education at a Glance (EAG) statfest – all 495 pages of it – was just released. Now it’s our turn to dissect some of what’s in there.
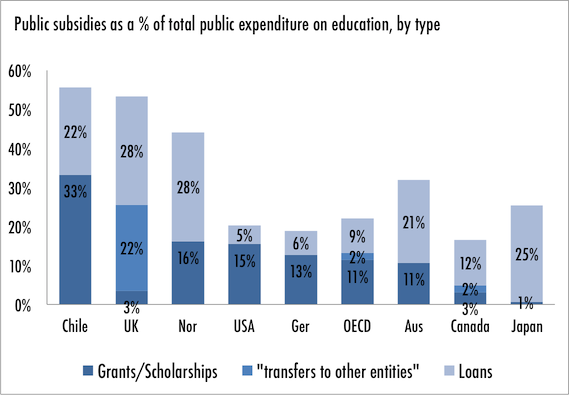
Of most immediate interest was chart B5.3, which shows the relative size of public subsidies for higher education as a percentage of public expenditures on education. It’s an odd measure, because having a high percentage could mean either that a country has very high subsidies (e.g., Norway, Sweden) or very low public expenditures (e.g., Chile), but no matter. I’ve reproduced some of the key data from that chart below.
(No, I’m not entirely clear what “transfers to other entities” means, either. I’m assuming it’s Canada Education Savings Grants, but I’m not positive.)
Anyways, this makes Canada looks chintzy, right? But hang on: there are some serious problems with the data.
In 2008, Canada spent around $22 billion on transfers to institutions. For the chart above to be right would imply that Canadian spending on “subsidies” (i.e., student aid) was in the $3.5 – 4 billion range. But that’s not actually true – if you take all the various forms of aid into account, the actual figure for 2008 is actually closer to $8 billion.
What could cause such a discrepancy? Here’s what I’m pretty sure happened:
1) StatsCan didn’t include tax credits in the numbers. Presumably this is because they don’t fit the definition of a loan or a grant, though in reality these measures are a $2 billion subsidy to households. In fairness, the U.S. – the only other country that uses education tax credits to any significant degree – didn’t include it either, but it’s a much bigger deal here in Canada.
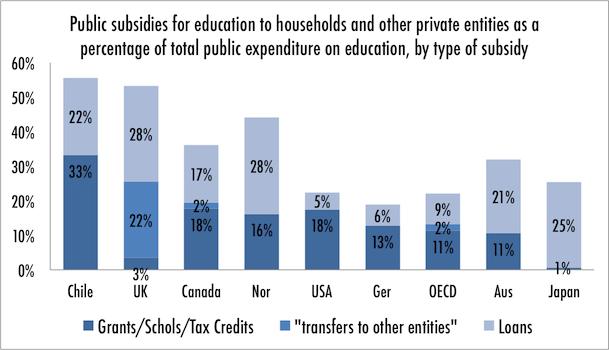
2) StatsCan didn’t include any provincial loans, grants or remission either. They have form on this, having done the same thing in the 2009 EAG. Basically, because StatsCan doesn’t have any instrument for collecting data on provincial aid programs, it essentially assumes that such things must not exist. (Pssst! Guys! Next time, ask CMEC for its HESA-produced database of provincial aid statistics going back to 1992!) So, what happens when you add all that in (note: U.S. data also adjusted)?
Not so chintzy after all.


 Tweet this post
