


As I mentioned yesterday, there was a big change in US student loan policy last week, namely with respect to income-based repayment. As I see it, the new rules make it one of the least onerous places in the world in which to repay student loans, by some standards. But before I substantiate this claim, I need to discuss how student loan repayments work around the world.
Trying to compare loan burdens across national borders can be tricky because the underlying logic of loan repayment rules are quite different. For instance, in Australia, the UK and New Zealand, loan repayments work more like taxes in the sense that loan repayment is algorithmically linked to income, whereas in Canada and the United States, the size of the outstanding loan principal also plays a role.
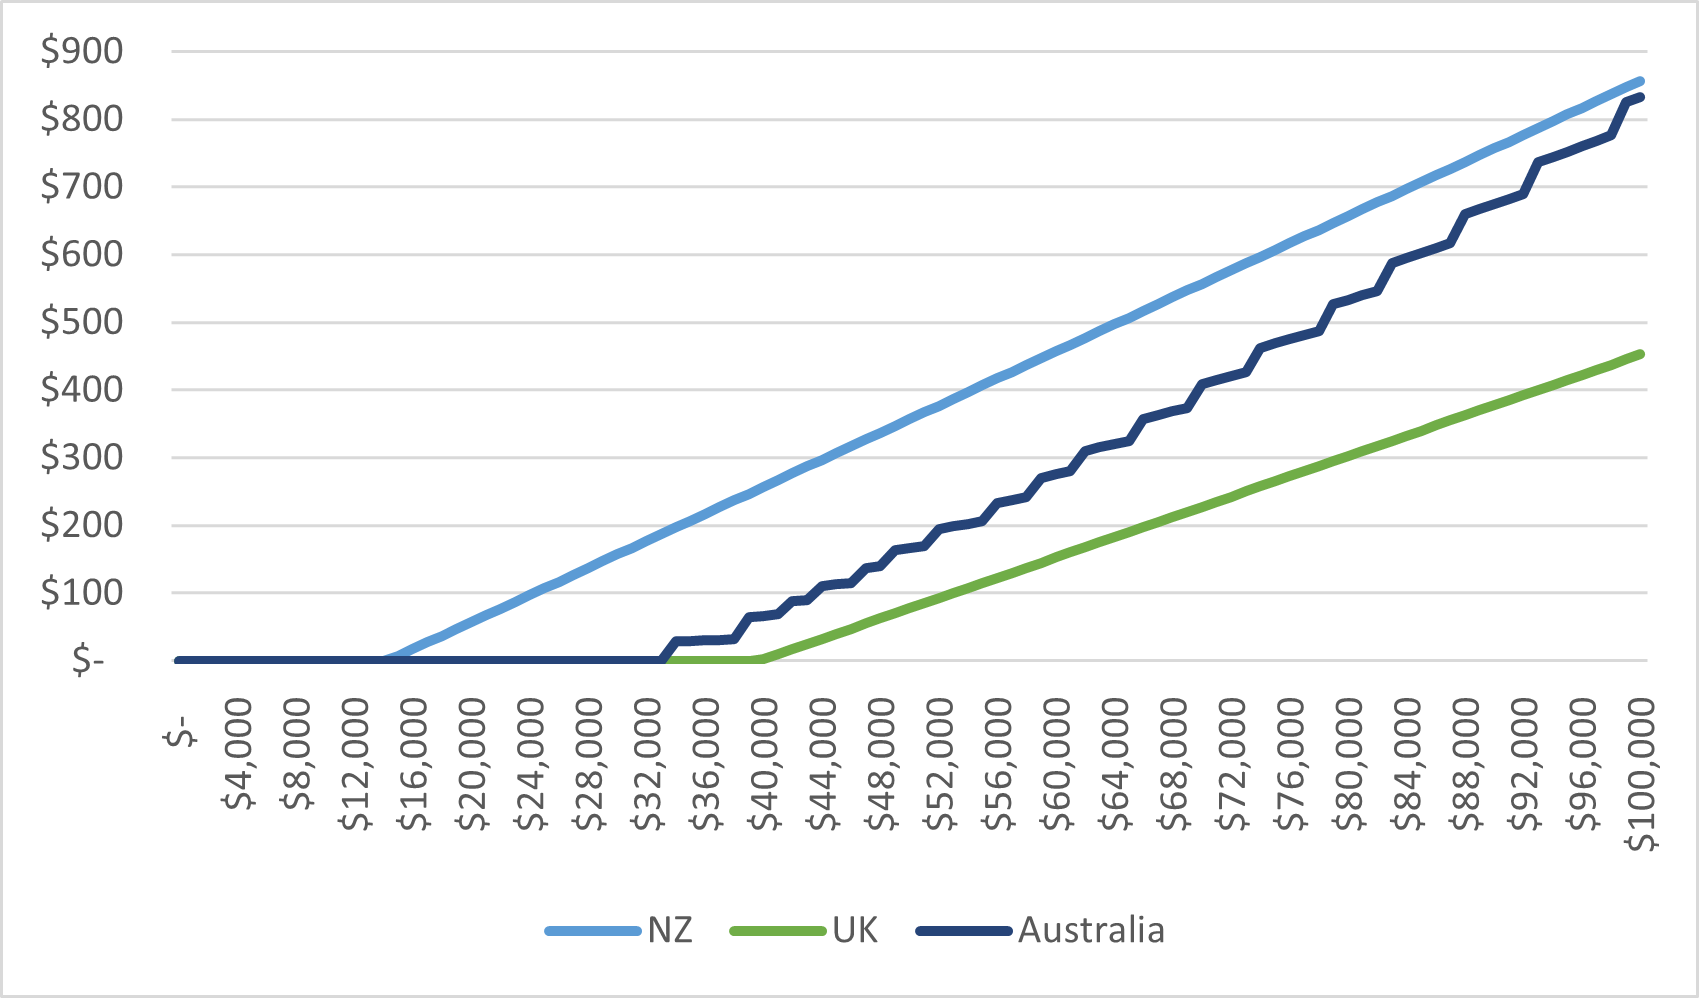
Let’s start this comparison by looking at the simplest countries to graph. In the UK, borrowers are required to start repaying loans when their income reaches £25,000 pounds, and their contribution rate is 9% of every pound over that threshold. In New Zealand, the counterpart figures are NZ$21,268 and 12%. Australia is a bit more complicated because it has a threshold below which no income is repaid (A$48,361) and then above that rate contributions are calculated on total income at an escalating rate (hence all the steps in the curve).
Figure 1 shows how these three countries compare against each other in terms of monthly repayment obligations at different levels of income (all figures are in USD at 2021 Purchasing Power Parity). New Zealand is by far the most demanding of borrowers in repayment, while the UK is least demanding, both in terms of its repayment rate and its repayment rate. Australia is in-between: for graduates with lower incomes, it looks a bit like the UK, but at higher levels it comes to resemble New Zealand.
Figure 1 – Required Monthly Student Loan Repayments by Annual Income, New Zealand, Australian and United Kingdom, in USD at PPP
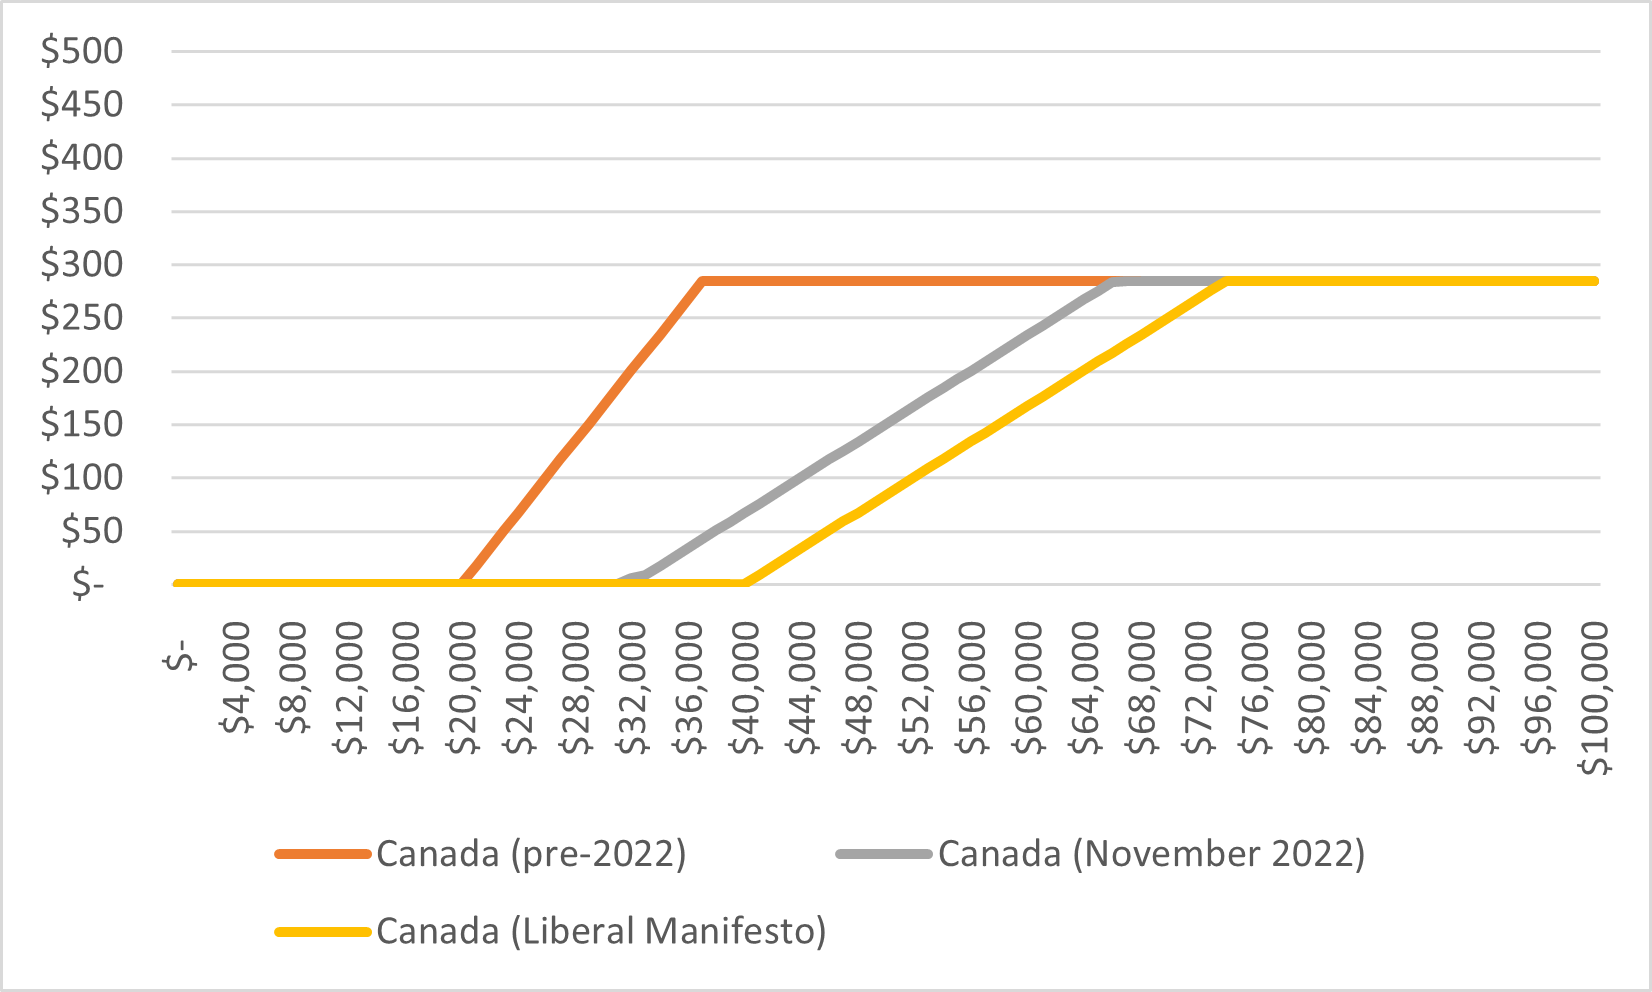
Now consider Canada, which is currently in transition across three different systems of education. Our loans are governed by something called the Repayment Assistance Program. At the moment, RAP limits repayments to 20% of income over a threshold of $25,000. As of November, the program will change so as to increase the repayment threshold to $40,000 and lower the repayment rate to 10%. And further, the Liberal Party’s last manifesto suggested pushing the threshold up again to $50,000. So, there are three different curves in all. But there is another aspect to repayment here, which is that debt payments are shaped by the amount owed at the start of repayment and the amortization period. So even though we have these income-based systems that sound like income-contingent systems in New Zealand or the UK, we also have maximum payments based on the amortization system. For comparative purposes, I assume in Figure 2 a debt of $25,000 US (about C$31,300) and use the RAP-mandated repayment period of 15 years.
The result is interesting. Payments top out at the same place under all three regimes at about US$285/month. But in the current system, borrowers hit that repayment level at about US$37,000 (C$46,361) in income – under the new system, students at that level of income will pay precisely $0. And under the system proposed in the Liberal manifesto, students will still not be paying back their full loans until they hit US$74,000 (C$92,722).
Figure 2 – Required Monthly Student Loan Repayments by Annual Income, Canada, Various Repayment Schemes, in USD at PPP
OK, so now let’s get back to the US system. It has a very low threshold to start repayment ($20,250) but, for recent loans at least, a relatively low 10% repayment limit above the threshold. The big difference with Canada is that to get access to these loans, you must shift to a 25-year amortization which radically lowers payments upfront but increases them in the long term. In any case, what it means is that an American with the same US$25,000 loan as our Canadian example only pays a maximum of $160/month (above that, they could shift out of an IBR loan and into another, simple amortization loan). And with the new announcement last week, even that won’t be payable until they hit $59,000 in income, as the repayment rate has now been reduced to just 5% above the threshold, the lowest repayment rate anywhere.
Figure 3 shows how the five countries stack up against each other at relatively low rates of income, where most borrowers would be in their first couple of years after graduation. Again, we see New Zealand as the most demanding of borrowers and the UK the least. Canada (at least the version of the Canadian system that comes into effect this fall) ends up looking like Australia. The US demands payment at lower rates of income but because of its new low 5% repayment rate, at the upper-end of this range it is not that different from either Canada or Australia.
Figure 3 – Required Monthly Student Loan Repayments for Lower-income Graduates, by Annual Income, Select Countries, in USD at PPP

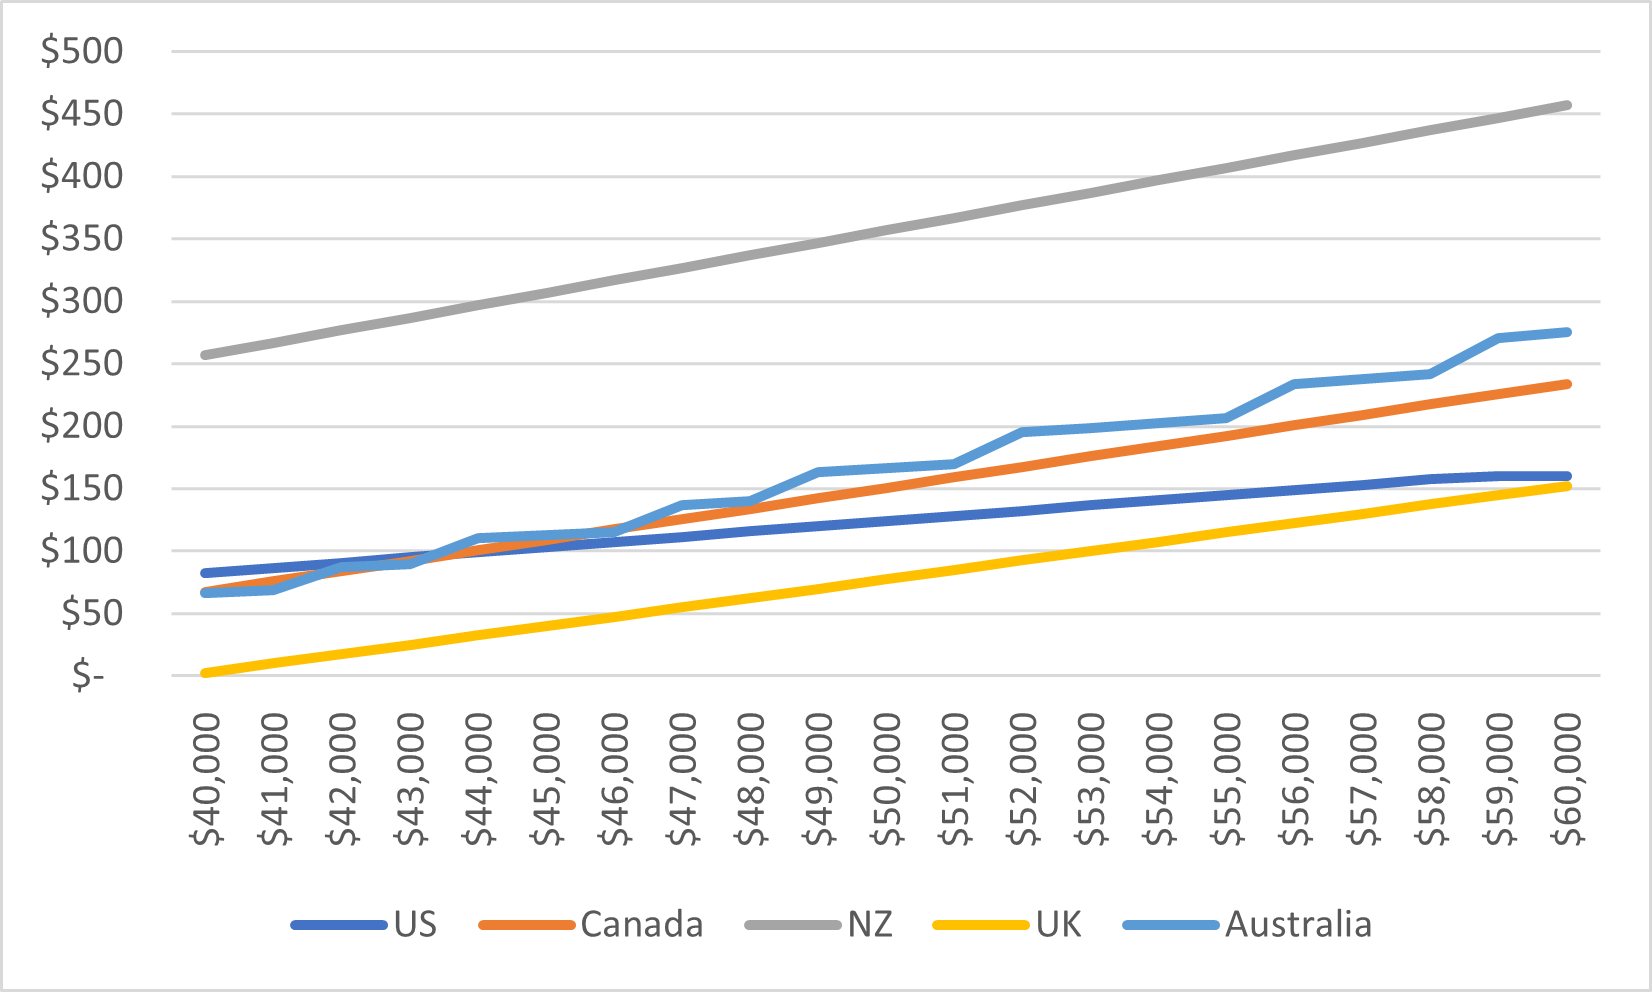
Figure 4 compares the five countries across the range of income where most students are a few years after graduation – that is between about $40,000 and $60,000 USD. Again, New Zealand and the UK form the upper and lower bounds, while Canada and Australia mostly track one another. But look at the US, where the relatively flat repayment curve and the topping-out of repayment at $160 per month means that by the time one reaches $60,000 it now has the least demanding repayment burden (though this is partially at the cost of paying interest for a longer period of time).
Figure 4 – Required Monthly Student Loan Repayments for Middle-income Graduates, by Annual Income, Select Countries, in USD at PPP
Now let’s look at the high end of the income spectrum. At this point, the three countries with fully income-contingent systems look the most burdensome, while Canada and the US begin to look very reasonable because of the maximum payment rules. Of course, because these are interest-bearing loans (at least for the moment – Canada at least is considering changing this), there is an incentive to pay more than the minimum to avoid incurring more interest charges. As a result, to some degree the US and Canada lines in figure 5 are notional and represent a repayment floor rather than actual repayments.
Figure 5 – Required Monthly Student Loan Repayments for Upper-income Graduates, by Annual Income, Select Countries, in USD at PPP

From the foregoing, it should be clear that the country with the “best” repayment system is something that depends a bit on where you sit on the income scale. But before jumping to conclusions, I wanted to add three more wrinkles to this comparison, and that is repayment periods, interest rates and rules on negative amortization.
The first is how long the repayment period is and whether there is forgiveness available if debt is not repaid. Canada looks very good on this measure because it forgives debt quickly; in Australia and New Zealand, debts keep getting collected until death (although given New Zealand’s aggressive recovery rate, it seems likely few actually have debt for all that long). The second is interest rates. Here New Zealand is the most generous of the five countries (zero interest for borrowers living in New Zealand and 2.8% for those living abroad) while Canada, for the moment at least, is the least generous.
Table 1 – Key Student Loan Policies, Selected Countries
| Repayment Period | Interest Rates | Negative Amortization Allowed? | |
|---|---|---|---|
| Australia | Indefinite | Equal to inflation | Yes |
| Canada | 15 years, followed by forgiveness | Prime plus 2.5% | No |
| New Zealand | Indefinite | Zero or 2.8% | No |
| United Kingdom | 25 years, followed by forgiveness | Inflation plus 3% | Yes |
| United States | 25 years, followed by forgiveness | 10-year treasury bond plus 2.05% | No |
And finally there is the question of negative amortization – that is the question of what happens to interest and principal when a students’ mandated repayment is not enough to cover the interest on the loan. If negative amortization is not allowed, that means the government in effect covers the cost of the interest to ensure that student loan balances can never grow post-graduation. In Australia it is allowed; so too in the UK, though in the end the government is on the hook for it eventually through forgiveness provisions. In Canada, government in effect forgives/writes off any negative amortization as it happens, while in New Zealand it cannot happen because of the zero-interest factor (the government still pays, it’s just a different mechanism). As a result of the Biden announcement last week, the US is moving to the Canadian system which raises costs in the short run, but arguably not in the long run (because the government would have had to forgive the accumulated negative amortization anyway after 25 years, in some loan programs at least). Whether or not it changes government costs, it will certainly change the perception of student debt; much of the ballooning debt of recent years has come not directly from loans accumulated at graduation but rather by the accumulation of interest.
And then of course, there is the amount of debt accumulated under each system, but that’s a story for another day.


One Response
Just a small note: Interest on Australian HELP Loans is actually pegged to the 2-year average inflation, presumably to soften rapid increases caused by runaway inflationary growth over one or two quarters.