


Today’s blog is a nerdy one, prompted by a question from a client: “how many post-secondary students are there in Canada”? If thinking about how Canadian governments measure the size of the student body isn’t your thing, feel free to skip today.
Let’s start by thinking about who reports student numbers. Institutions all have a good idea of how many students they have at any given moment, basically because they need to know who has paid (this sounds cynical, but it’s true – when Austria briefly brought in tuition fees about twenty years ago, universities there suddenly discovered that about ten percent of the student body hadn’t actually attended classes in years, but stayed enrolled in order to access discounted public transportation fares; once fees were introduced, the numbers became more accurate). Crucially, though, there is no compelling reason for them to publish this information on their own (and indeed many do not), nor is there a compelling logic for them to publish whatever they have in a standardized manner.
Provincial governments, on the other hand, do have some incentive to get institutions to tell them how many students they have in a standard format, mainly because in some (not all) provinces, the institutional grant partially depends on this number. While provinces need to satisfy their own requirements, they are pretty indifferent about making such data public, and definitely have zero interest in doing it in a common pan-Canadian format. Alberta and British Columbia publish limited data on “full-load equivalent” student numbers by institution, Ontario releases an astonishing amount of information on institutional enrolments through its Open Data website, but only for full-time students (does it not collect data on part-time students? ¯\_(ツ)_/¯), while in the Atlantic provinces universities (but not the colleges) quickly publish reasonably thorough (6 weeks after the school year starts).
And that brings us to StatsCan. Despite being unbearably slow (Burkina Faso manages to publish enrolment data faster, despite all the coups), and only partially free (you must cough up a few hundred dollars to get institutional level data) StatsCan data is at least comparable. But – and this is perhaps under-appreciated– because there is not really any money resting on the outcome of its counts, it doesn’t have quite the same interest in counting or reporting things in the same way as institutions and provinces. Specifically, because all StatsCan wants is a common number which can be arrived at relatively cheaply, it counts students rather differently than provinces, based on a snapshot at a single point in the calendar year. Provinces tend to attempt to count the number of students who attend at any point in the calendar year.
Let me underline this point to emphasize how big a difference this is. When you are looking at StatsCan data on student enrolments, what you are looking at is the number of students enrolled on one specific snapshot date (StatsCan leaves the actual date to the individual institutions, but it has to be sometime between September 30 and December 1st). But this excludes everyone who was not enrolled in that date but enrolled at another time in the year. Went to school in Winter, Spring and Summer terms, but not the Fall term? As far as StatsCan’s concerned, your data is not worth capturing (note that this means we literally have no way of knowing how many students are enrolled during the summer – data that might have come in handy in the Spring of 2020). Provinces with no interest in making data public or comparable will (mostly) have this data captured, but nationally we’ve got nada.
Now, think for a second about how this affects the portrayal of enrolments. A fall snapshot probably makes a certain amount of sense in universities, where most students start in the fall, but in colleges – where only about half of all students start their program in September – it makes much less sense.
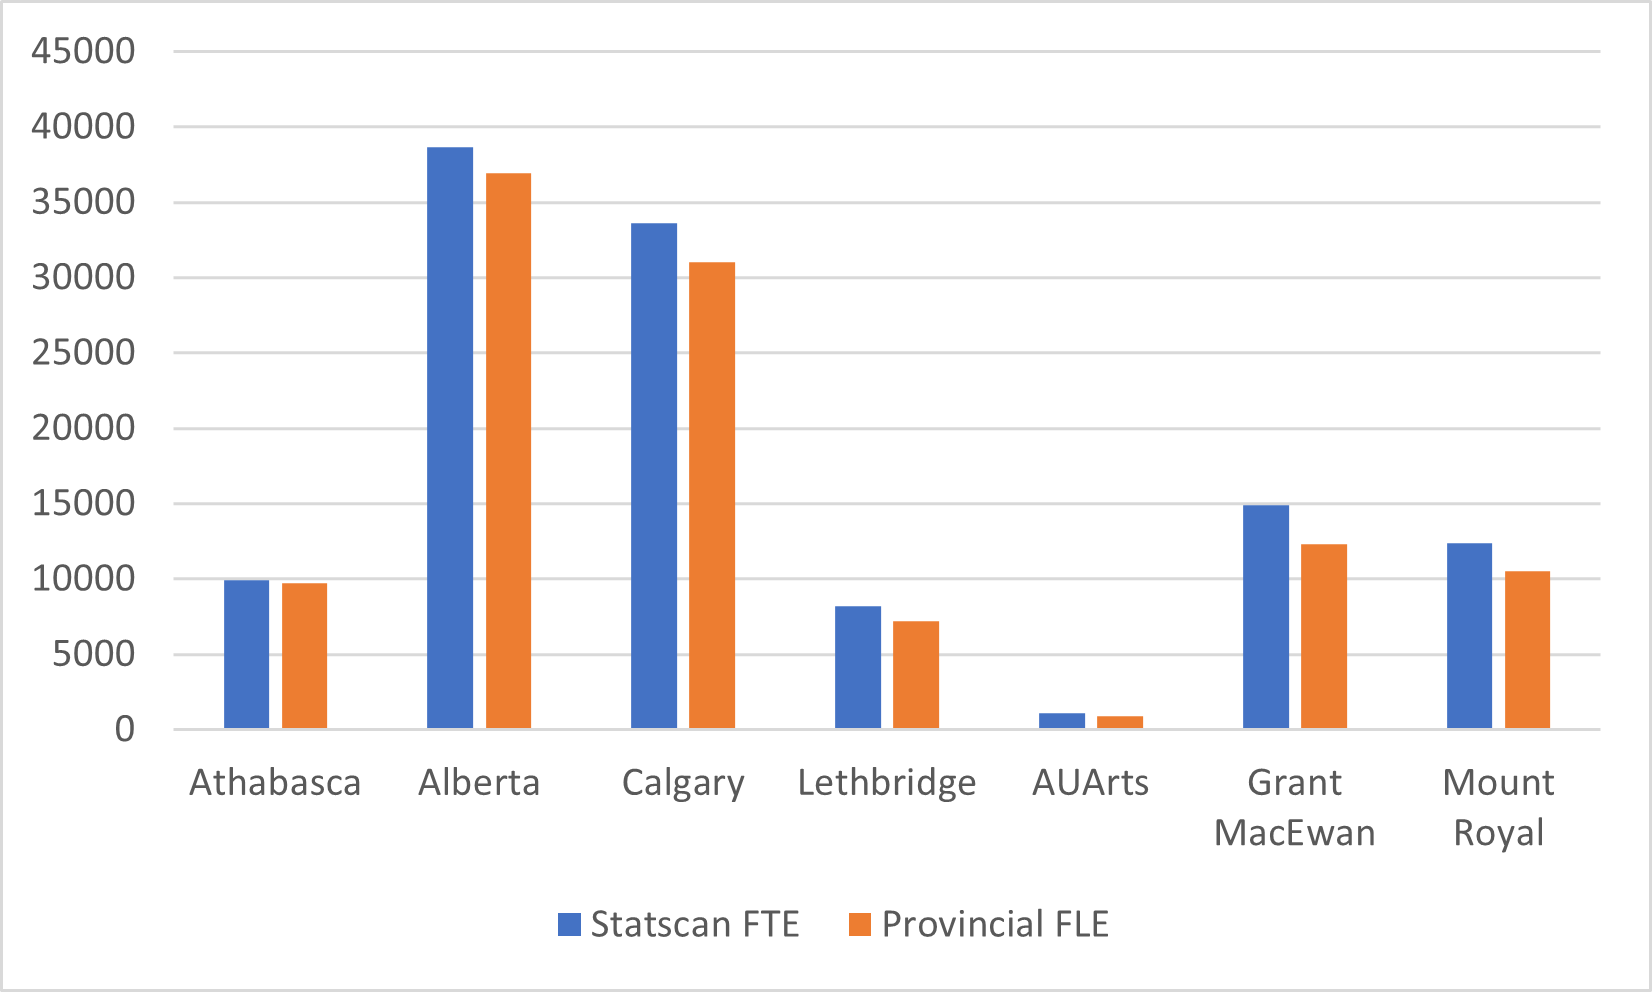
To give you a sense of how different these numbers are, let’s look at Alberta, a province where I have both StatsCan and provincial data for the years up to 2018-19. So, the blue bars in Figure 1 show how many full-time equivalent students StatsCan’s fall snapshot suggests each Alberta university has (FTE = full time + (part-time/3.5)), while the right-hand column shows how many provincially-defined “full-load equivalent” students each institution has (FLE is an unnecessarily complicated formula but to a degree of approximation, if a full-year is 30 credits then FLE is total credit enrolment across an entire year divided by 30). Overall, the StatsCan numbers are about 9% higher than the provincial numbers, though in the case of the three newest universities it is closer to 20%. My suspicion here is that a lot of the difference comes from students taking 4 courses per term being defined as “full-time” by the institution and reported to StatsCan as such, but they are only counted as 80% of full time by the provincial system.
Figure 1: Statistics Canada Full-Time Equivalent vs. Provincial Full-Load Equivalent, Alberta Universities, 2018-19
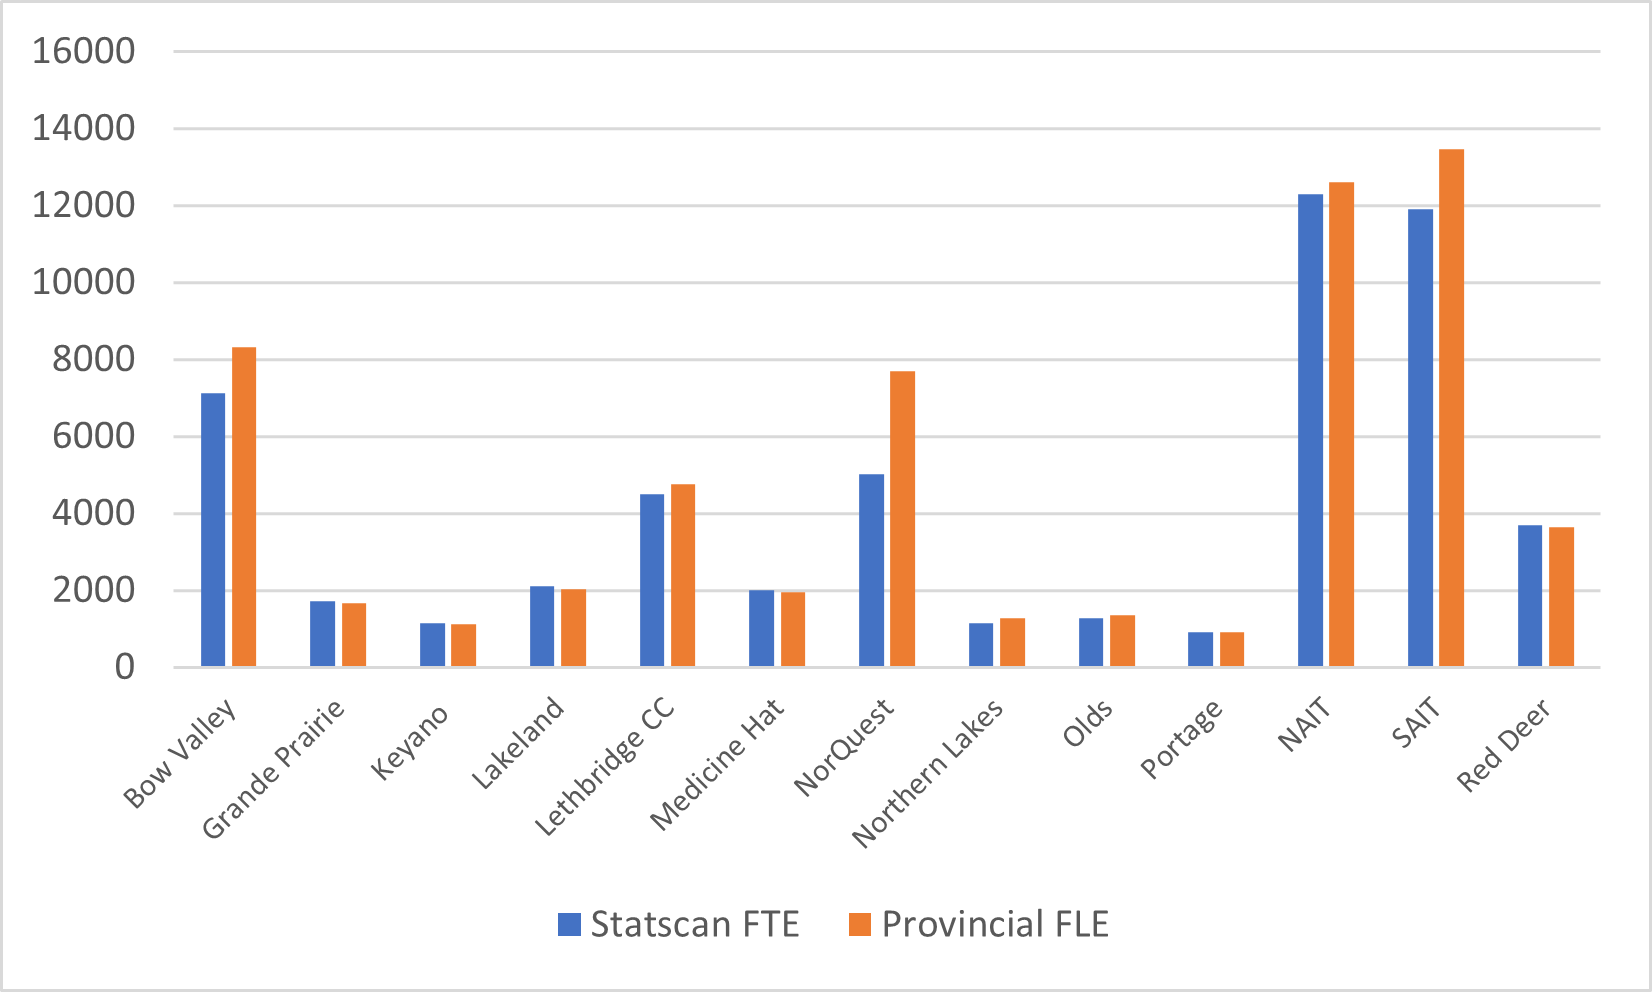
Now let’s look at the college numbers, shown below in figure 2. For smaller institutions, the difference is negligible (mainly, I think because they actually don’t have too many non-September start dates because if they did the resulting class sizes would be uneconomically small). But boy, those big urban institutions sure look different. At NorQuest, the StatsCan number undercounts the provincial one by 35%, and the undercount is in double digits at both SAIT and Bow Valley.
Figure 2: Statistics Canada Full-Time Equivalent vs. Provincial Full-Load Equivalent, Alberta Colleges, 2018-19
Got that? Relative to the actual full-year, full-load population (which is almost certainly a better measure of participation), StatsCan overcounts university students to the tune of 9% and undercounts colleges by 10%, in Alberta at least. If you apply that to the country, it shifts the university/college mix from a little over 65/35 to around 60/40. Maybe not a whole lot, but still worth remembering whenever you see national statistics (including from me!).
Could StatsCan and the institutions which report data to it do better? Of course, they could. The US Department of Education captures both a fall enrolment snapshot and a 12-month enrolment as well. We simply choose not to. Because, you know, effort is required, and no one cares about data in Canada anyway.
And then of course there’s the whole thing about literally no one collecting data on non-credit education, but that’s a separate disaster for another column.

