


I haven’t looked at community college finances recently and Statistics Canada just released the most recent FINCOL survey data, so it’s good time to return to the subject. I’ll stay focussed on the revenue side rather than the expenditures side, because frankly it is a lot more interesting (the expenditure side does not change much year to year and if you really want to examine that, take a look at Chapter 3 of The State of Post-Secondary Education in Canada, just a simple free download from HESA Towers’ gorgeous new website).
Be warned: this is going to focus a lot on Ontario and international students.
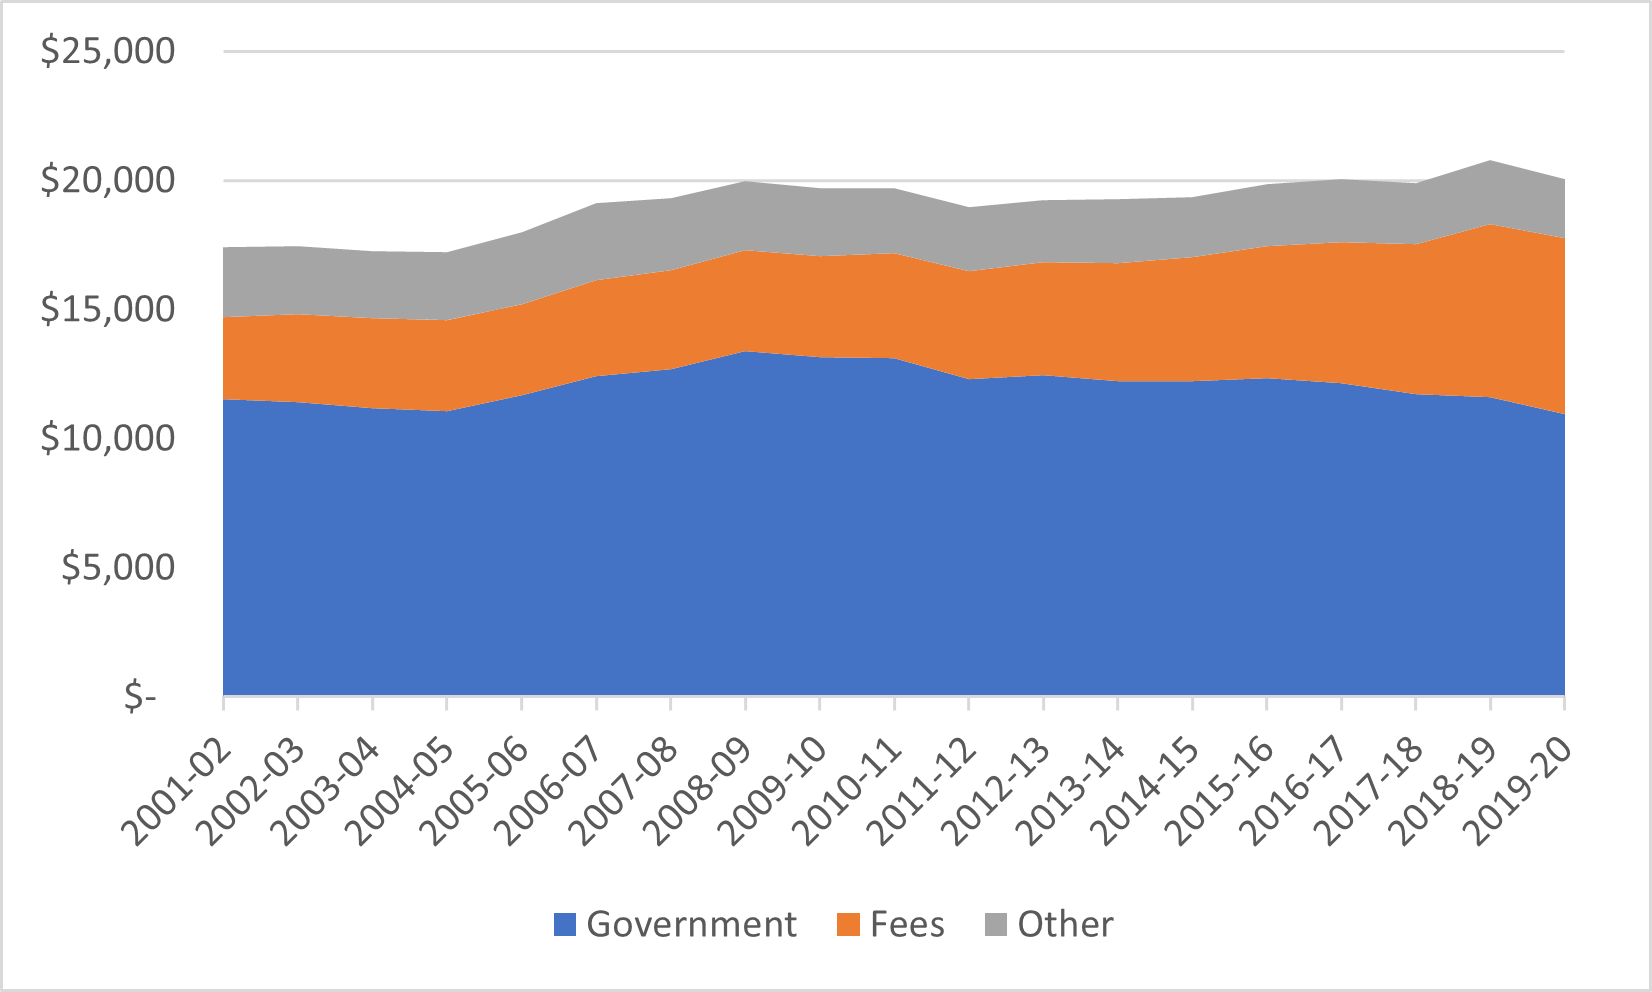
Let’s start with the basics in Figure 1. Over the past twenty years, community colleges have gone from being a roughly $9 billion/year enterprise in Canada to being a $13 billion/year one, which is a significant jump considering that a number of fairly large colleges (MacEwan, Mount Royal, Emily Carr, Malaspina, Fraser Valley, Kwantlen and Cariboo) switched from being classified as colleges to universities during this period and thus were removed from the college side of the equation. Of course, since 2010, exactly none of that growth has come from public funding. Instead, it comes from students: and specifically, over the last five years at least, international students.
Figure 1- Total Community College Funding by Source, Canada, 2001-02 to 2019-20, in Billions of Constant $2019

Another way to look at this trend is examining dollars per student. More or less, the overall expenditure per student in real dollars has stayed the same: however, for the past decade student dollars have been replacing government dollars (note of course that this replacement factor would look quite different without international students, both because the number of domestic students has declined in absolute terms (which would push per-student government expenditures upwards) and because of the influx of international students (without which the fees figure would be much smaller)
Figure 2- Total Per-Student Community College Funding by Source, Canada, 2001-02 to 2019-20, in Constant $2019
However, it is important to remember that Canada is far from homogenous in the way its colleges are funded. Figure 3 shows total income, and the division of that income by source for Ontario, Quebec and the Rest of Canada. Ontario colleges, which take in almost 40% of total college revenues across the country, receive less than one-third of their income from the provincial government; the equivalent figure in Quebec is 85%. Fees of various kinds make up 54% of all income; the equivalent figure in Quebec is 7%. The rest of the country occupies a middle ground where tuition fees still make up a majority of institutional funding but tuition fees are still close to a third of total income.
Figure 3- Total Community College Funding by Source, Canada, 2019-20 in Billions

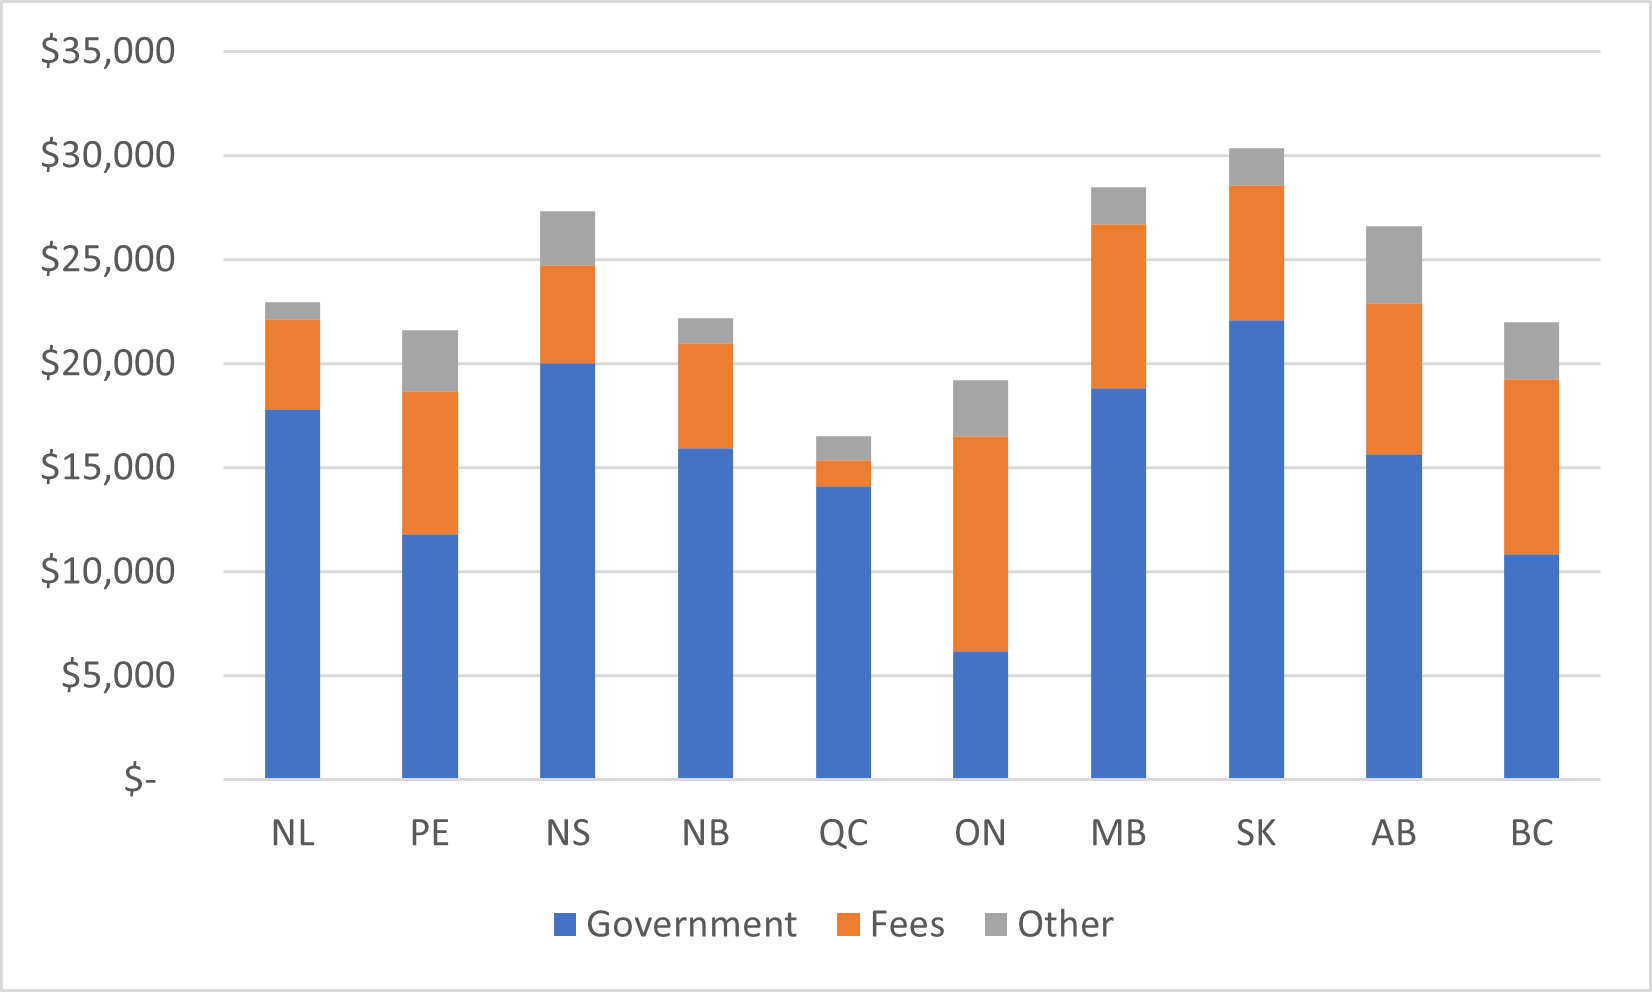
That’s still not the full story. It is worth looking at the data from Figure 3 on a per-student basis, because that gives you a better sense of how this plays out at the level of institutional funding. The problem is that Statistics Canada’s method of calculating full-time equivalencies is not ideal for looking at college enrolment. StatsCan enrolment is a snapshot: it’s a headcount of everyone enrolled in an institution at some point in the fall (October 1st, IIRC). This is not a terrible way to count university students, but in colleges with more continuous enrolments, it’s likely to lead to an undercount, and the extent to which it is an undercount is going to differ slightly from province to province. So don’t take the specific absolute data points in Figure 4 too literally: think of them as being “in the ballpark” relative to one another.
Anyways, what you see in Figure 4 is that all that international student money in Ontario actually doesn’t bring per-student spending up to the level in most other provinces, and neither does all that government money in Quebec. In fact, it is the provinces that have found more of a balance between public and private financing that seem to have the best overall dollar per-student numbers.
Figure 4- Total per-Student Community College Funding by Province and Source, Canada, 2019-20
Of course, it has not always been like this. Ontario’s outlier status is to a large degree a product of an insatiable lust for international student dollars. Figure 5 shows the growth of tuition income for selected provinces: in Ontario it has quadrupled in real terms since 2001-02; outside the three largest provinces, it has not yet increased by 50%.
Figure 5- Change in Community College Tuition Revenue by Province 2002-02 to 2019-20 (2001-02 = 100)

Two interesting questions going forward. First, in Ontario: institutions in effect have self-privatized by going and capturing all that international money. Are they likely to stop now? Is it in the public interest that they continue to move in this direction? What steps, if any, could a government take to stop them even if it wanted to? Second, in the rest of the country: will Ontario be seen as a bonanza to imitate, or a cautionary tale to avoid?
This story still has some ways to go.

