


Statscan released new data on community college enrolments and finances last month. That’s an excellent opportunity for me to update some of my favourite charts.
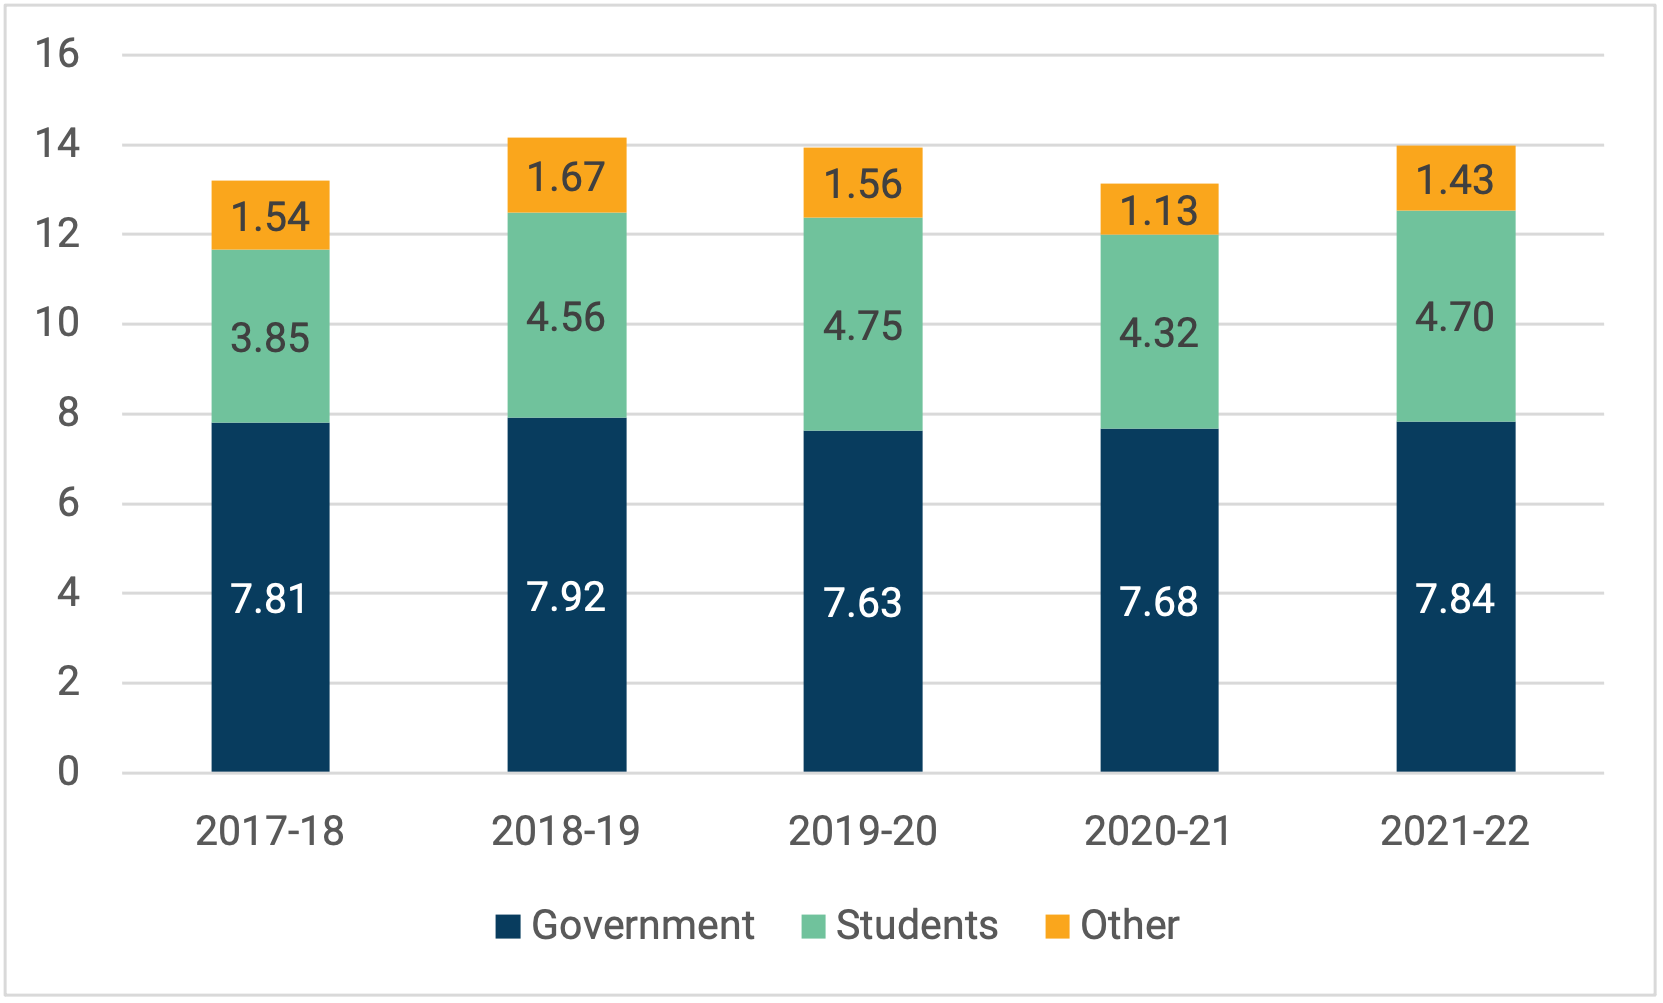
Let’s start with what’s been happening in terms of income over the past couple of years. Turns out college revenue has been relatively stable at $14 billion over the past few years. The only exception was the COVID year of 2020-21 where income fell to $13.1 billion partly because of reduced tuition income (fewer international students) but also because of lower ancillary revenue (less income from cafeterias, parking, etc).
Figure 1: College Income by Source and year, Canada, 2017-18 to 2021-22, in real $2021
Canadian college budgets vary enormously from one province to another both in terms of size and source as you can see in Figure 2. For instance in Saskatchewan, total funding per FTE student is about $33,000 per year, whereas in Quebec it is a mere $18,000 per year. That’s a pretty big gap. But equally important are the differences in the manner in which colleges are funded. Provincial funding in Ontario is so low ($6,339 per student) that literally every other province is above the national average ($11,449), but it makes up for it somewhat by extracting an enormous amount of fees from students (on average, $11,207 per student, though obviously this is driven predominantly by international fees). Quebec’s level pf public FTE supports is about 2.5x higher than Ontario, but total per-student funding is lower simply because CEGEPs have almost no non-public sources of funding.
Figure 2: Total Per-student College Funding by Province and Source, Canada, 2021-22
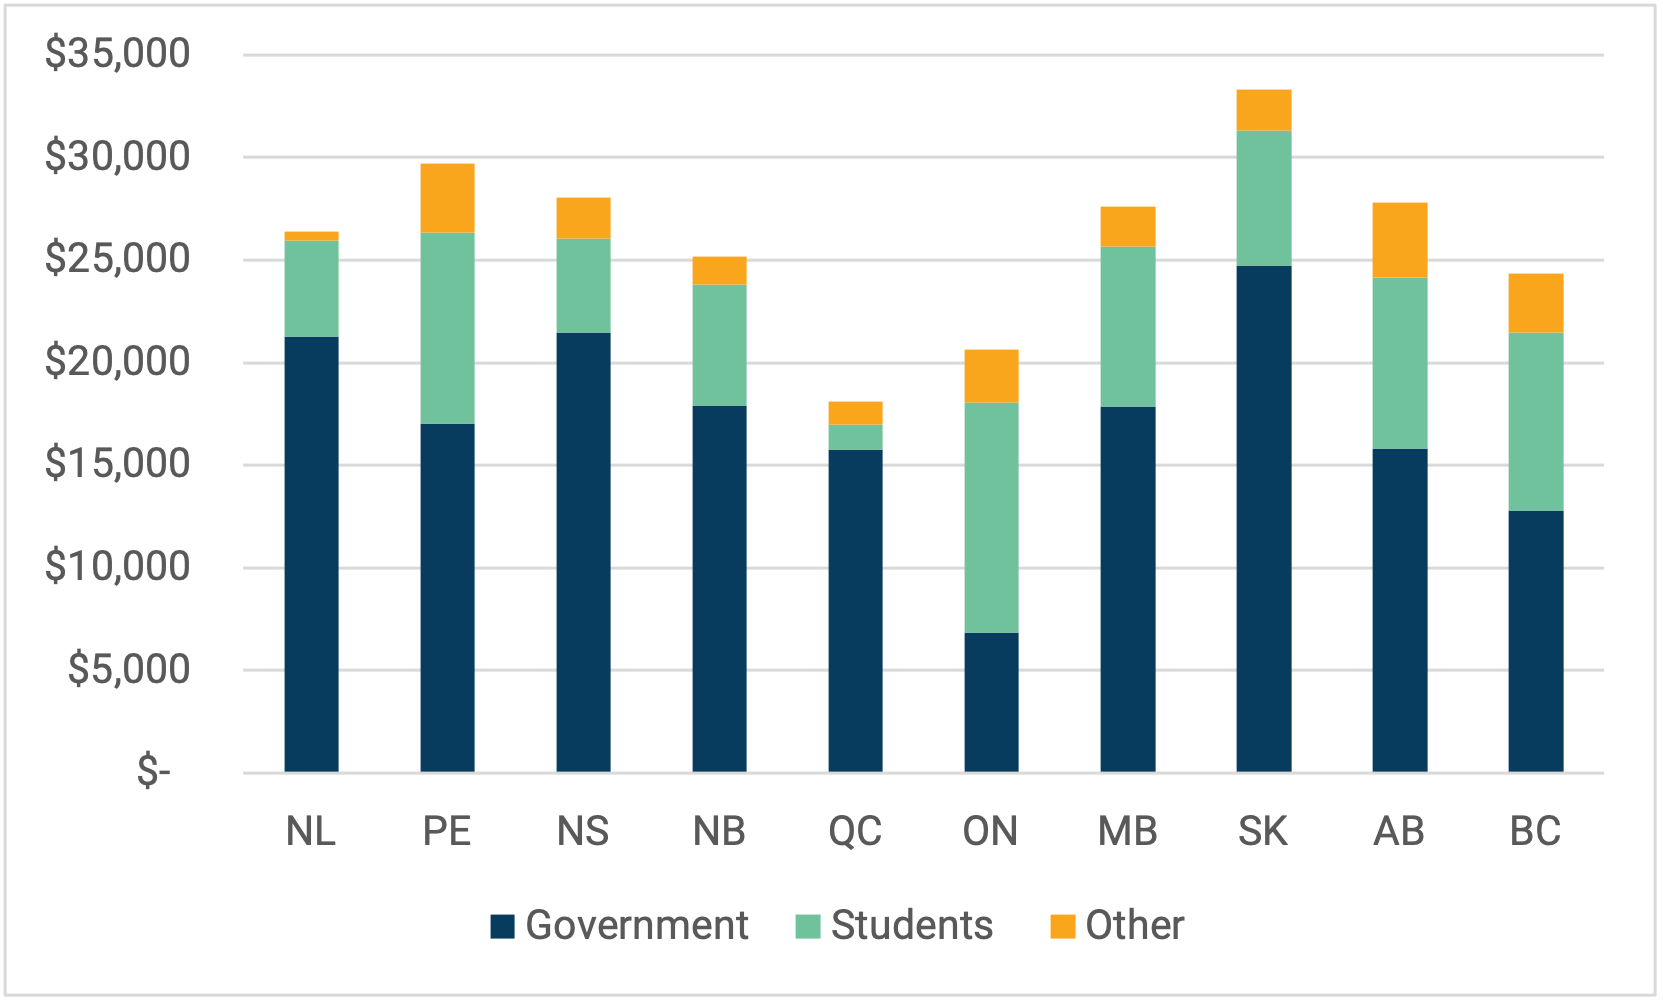
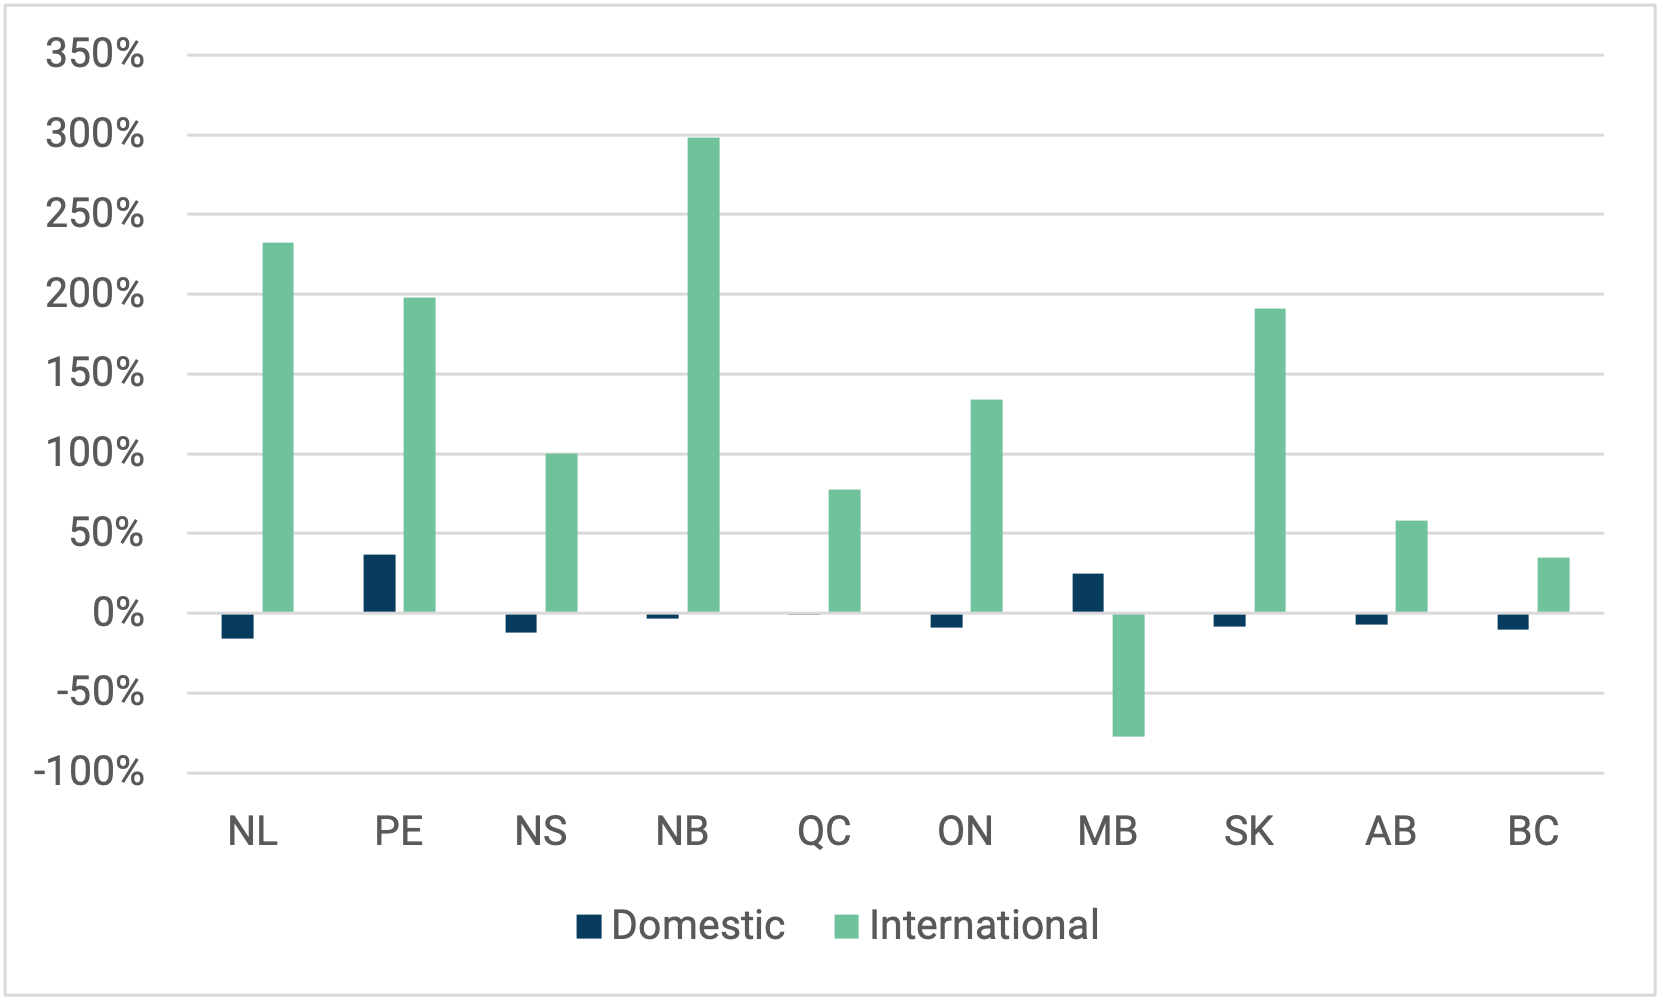
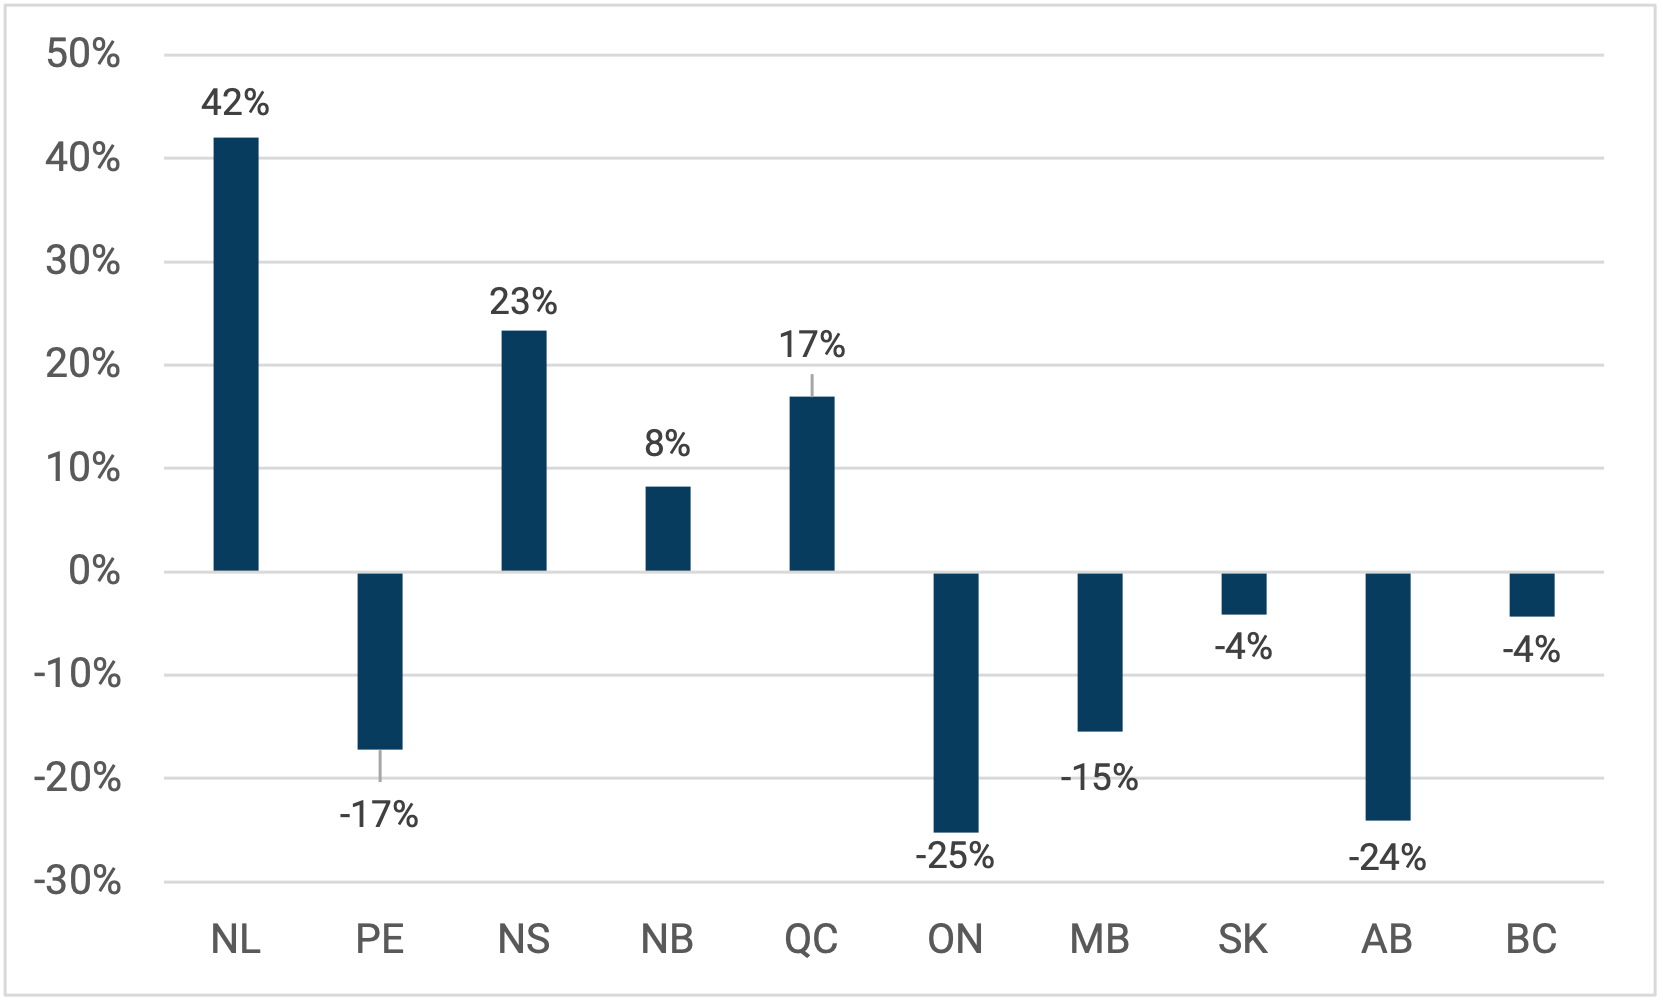
Figure 1 suggests that international student dollars – and thus presumably absolute numbers – haven’t changed much in the past three years. Chalk that up to two things: i) COVID and ii) this is data from Statistics Canada, where timeliness is ¯\_(ツ)_/¯, so the “most recent year” is 28 months ago. But if you take an even slightly longer point of view – five years, say as shown below in Figure 3 – then you see some bigger changes. International students are up, nationally by 102% in the past decade, with 72% of all of these students now located in Ontario (again, these numbers will be more extreme once we get data up to 2023). But perhaps more important is that over the past five years, domestic enrolment is down 6% nationally, and in eight of ten provinces with Manitoba and Prince Edward Island being the exceptions. (And no, I have no idea why Manitoba is reporting an 80% drop in international students in 2021-22. Best guess is that there is assume some kind of coding mistake).
Figure 3: Percentage Change in Domestic and International Enrolment by Province, 2016-17 to 2021-22
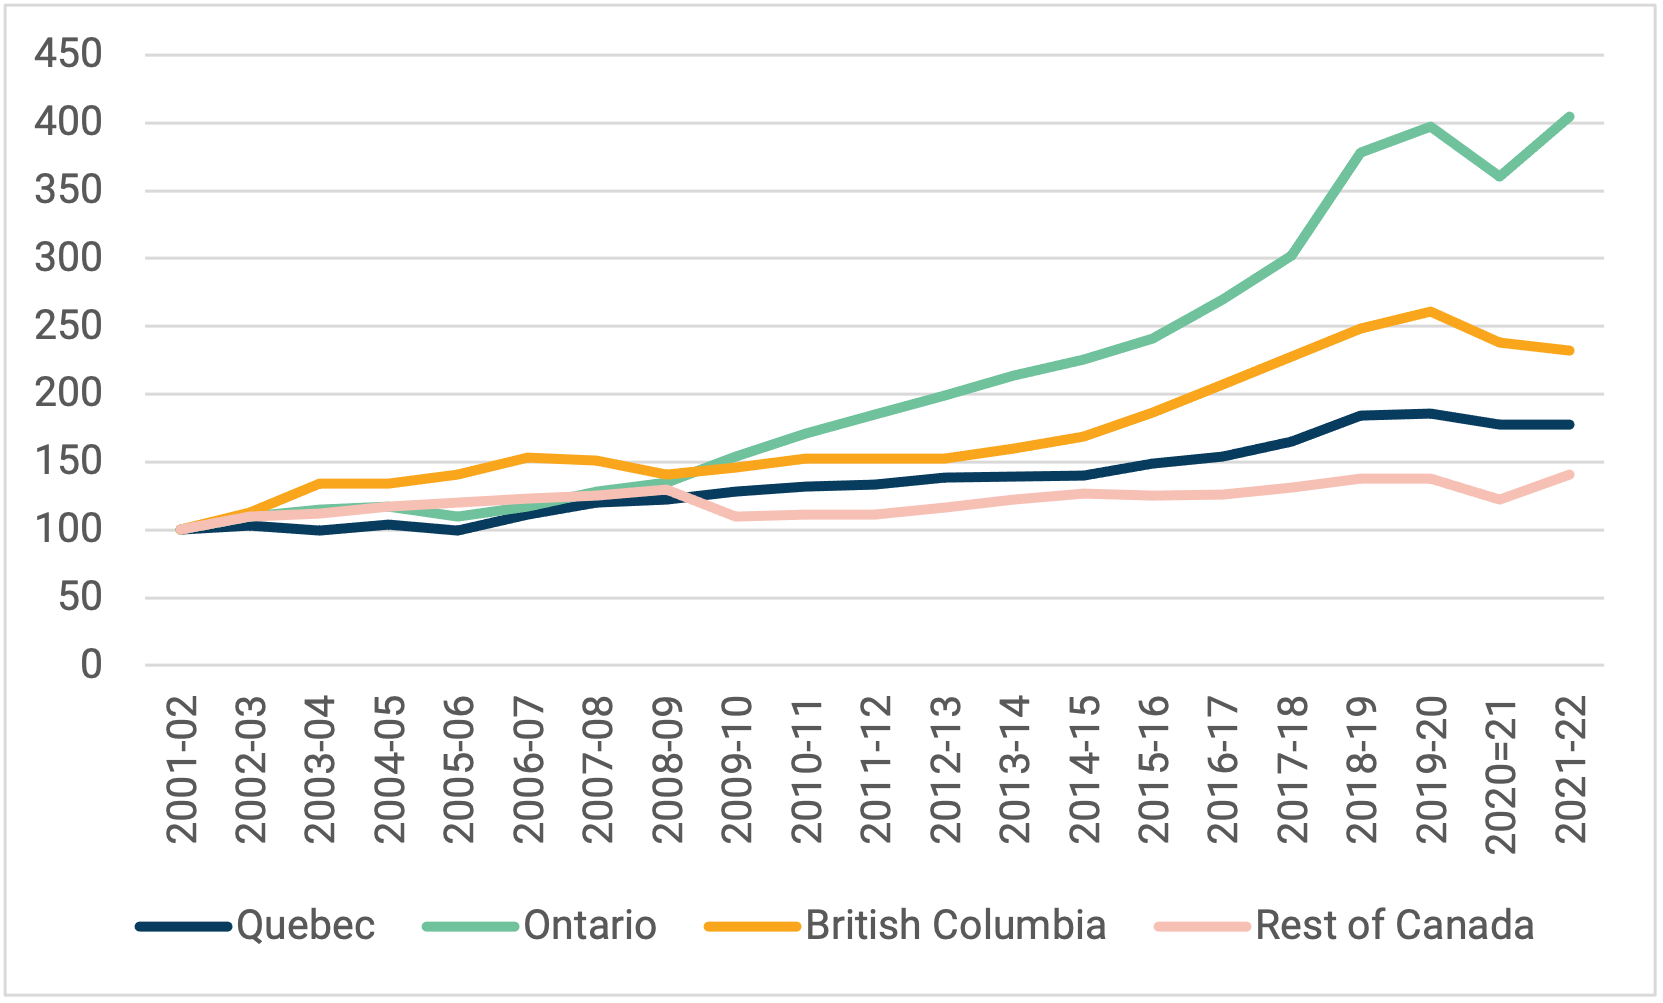
Now if you take an even longer look back, as I do in Figure 4 you can see how changes in international enrolment – and hence income from tuition fees, since these are usually 2-3x higher for international students) – have affected total fee income for colleges. In Ontario – which has gone most hog-wild for international students, income from tuition increased fourfold between 2001 and 2021. In British Columbia, the increase was 150%; in Quebec (where fees were negligible to begin with) they increased by about 80%…but in the other seven provinces combined the increase was less than 50%. Suffice to say that the college sector’s behaviour towards international students (and the income they represent) has varied considerably across the country.
Figure 4: Change in Aggregate Real Fee Income by Province, 2001-02 to 2021-02 (2001-02 = 100)
Let’s move away for a second from student fees and look at provincial government expenditures per student over the past decade. Now, figure 5 might look a little counter-intuitive, but you need to remember that figure is a ratio—if you see a province unexpectedly increasing its expenditures, it might be becausedollars are increasing faster than student numbers (see: Quebec), but it might also be because expenditures are staying stable while student numbers are falling (see: Newfoundland, and to a lesser extent Nova Scotia and New Brunswick). Similarly, if you a decrease here, it might be because dollars are increasing less quickly than students numbers (see: British Columbia) but it might also be student numbers running ahead of expenditures (see: Manitoba). If you add all these up, it amounts to a decline of -7% over a decade – which is roughly in line with the decline in domestic student numbers as it happens – but the vast differences between provinces means it’s hard to see a real pan-Canadian pattern here.
Figure 5: Change in Real Provincial Government Transfers to Colleges per student, 2011-12 to 2021-22
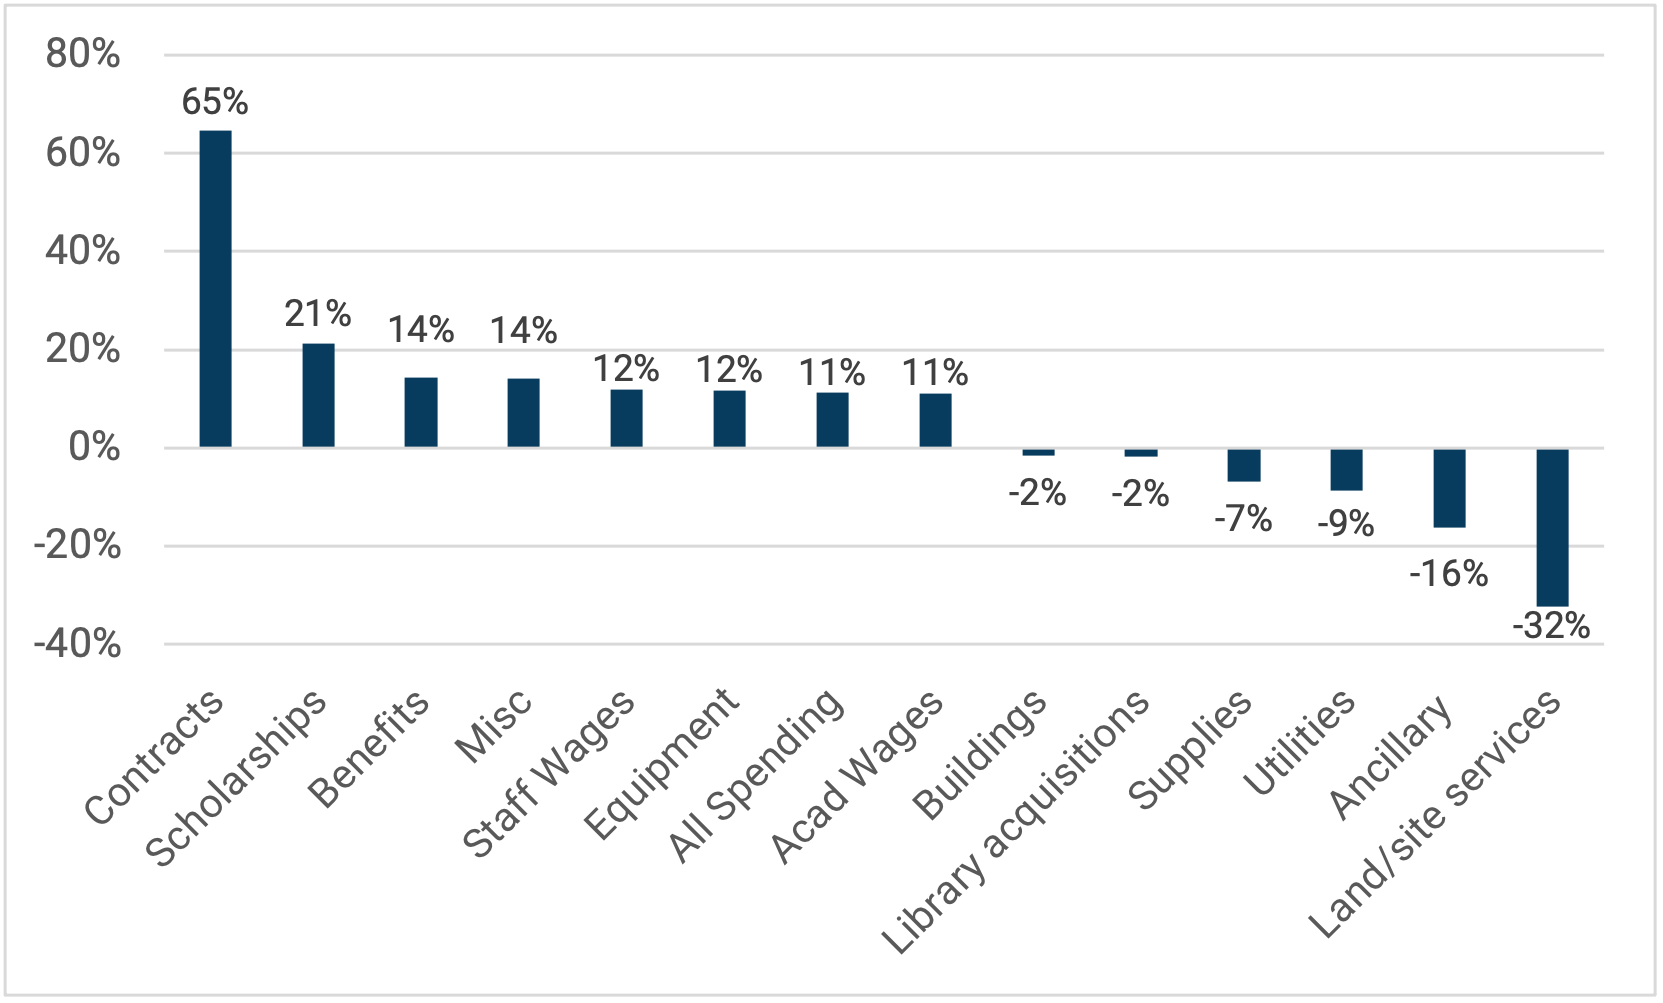
Now finally, to the question: where is all this money going? Well, in Figure 6, you see that the real (i.e., after-inflation) increase in spending was about 11%, and most of the big-ticket items (e.g. wages for both academic and non-academic staff, equipment, benefits, etc.) are all pretty close to that. The big declines were for ancillary services and land/site services, both of which I suspect are still due to COVID in 21-22. And the big increase? Contracted services. We’ve already seen that the biggest change in community colleges has been for the last few years has been an increase in international students. A lot of this “contracted services” money will be ether fees to agents, or—in Ontario at least—fees to private colleges operating under PPP agreements (see my explainer on this back here if you’ve forgotten the details).
And now you’re up to date on college income and expenditure!

