


So now we come to the heart of the matter: what’s actually going on in terms of publication outcomes (both the number and the impact)? For the first couple of graphs, I’m going to include the 11 top-200 schools from the People’s Republic of China just for the sheer fun of it (I have China data for research, but not finances). Figure 1 takes shows the increase in research output at top-200 universities, by country, for the years 2014-2017 over the 2006-2009 quadrennium.
(Data is from the Leiden Rankin, if you’re interested).
Figure 1: Percentage Change in Scientific Publication Output at Top-200 Universities, by Country, 2006-2009 to 2014-2017
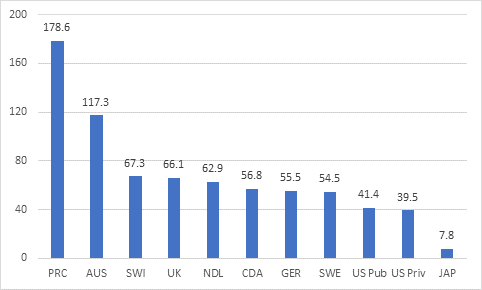
Now you’ll note that research production is up pretty much across the board, with the exception of Japan. That’s partly a reflection of the fact that academia has become more research-heavy, but it’s also indicative that more journals are getting indexed each year, so partly what you are seeing here is a change in indexing practices. There are a few important takeaways form this graph. First, Japanese universities are really performing well below everyone else. Second, US universities are seeing lower rates of increases than other countries. Third, China: wow. Wow, wow, wow. And fourth: whatever they are doing in Australia is clearly pretty impressive.
Figure 2 looks at changes in field-weighted impact at
top-200 institutions in various countries between 2006-2009 and 2014-2017, as
measured by the percentage of papers from these institutions that end up being
in the top ten percent most-cited papers within their field published in the
same year. One of the really interesting things here is that impact is up
basically everywhere. How can that be? Well, it might be that highly-cited
articles are more likely to be written by profs at top-200 institutions than
was the case a decade ago. But it also might be that as more journal articles
get indexed, the new articles (generally from lower-circulation journals) are
cited less and so the weighted-value of articles from journals already in the
index would go up. In other words, an individual publishing the same number of
articles in the same journals with the same number of citations could still see
the field-weighted value go up because of a change in the way “the field” is
measured. Hard to tell which is going on, but probably safe to assume it’s a
little from column A and a little from column B.
Figure 2: Percentage Change in Number of Scientific Articles Which Achieve Field-Weighted top 10% Most-cited at Top-200 Universities, by Country, 2006-2009 to 2014-2017
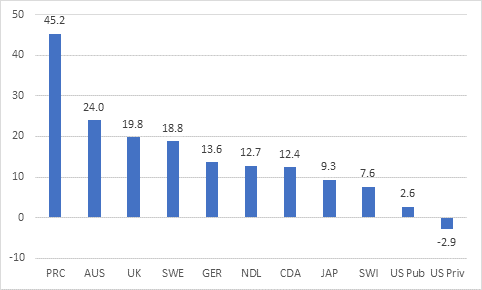
Still, there are some interesting patterns here that echo what is going on in figure 1: to wit; the US is losing pre-eminence, and China and Australia are gaining it. In China, you could probably make the argument that this is about a massive decade-long infusion of resources; in Australia it’s quite clearly not and so must have something to do with the way institutions are being managed.
Now, if you cast your mind back to Tuesday, I started by talking about how two years ago I looked at similar resource and output data and found very little correlation between resources per student and either article production or impact. This time, I looked for correlations between output, impact, and five different measures of resources: total expenditures (which, as I’ve explained before, over the long term is a less volatile proxy for total income), expenditures per student, expenditures per professor, total research income, and research income per professor. Out of those ten relationships, the strongest was total expenditures to publication output, which as you can see in figure 3 was not in fact very strong at all. In a couple of cases, the relationships actually appeared to be negative.
Figure 3: Change in Institutional Expenditures vs. Change in Scientific Publication Output at Top-200 Universities, by Country, 2006-2009 to 2014-2017
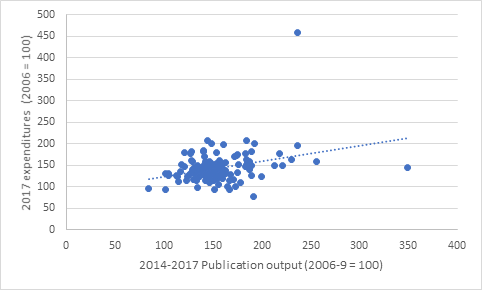
So, it seems like the initial finding of a couple of years ago still stands: at least among top-200 institutions, adding additional resources does not appear to correlate with stronger research outcomes. This echoes the results of the University of Ottawa’s Jean-Michel Fortin and David Currie in their 2013 article, Big Science vs. Little Science: How Scientific Impact Scales With Funding, which examined the amount of NSERC money received by individual researchers and linked it to various bibliometric outputs. Their conclusion was that at the level of the individual, outputs were only weakly correlated with scientific impact—and even this was subject to a plateau beyond which the relationship became much weaker.
Caveats apply here, of course. The results only apply to top-200 institutions in major industrial countries (money might make a bigger difference for a university that was not already research intensive). The results correlations would almost certainly look a bit different if China were included, where ridiculous amounts of new money pretty clearly did make a difference. China was excluded because institutional-level finance data is only available since 2012; although, that said, China is so self-evidently sui generis it’s not clear how relevant its inclusion would be. And of course, publications and citations aren’t necessarily the best ways to measure the value of research done at an institution.
Nevertheless, the overall results – particularly those from Australia and the Netherlands, both of which have adopted relatively centralized management models over the past couple of decades – suggest that perhaps active management of research outputs has a bigger impact than mere financial inputs. Something perhaps federal bureaucrats should keep in mind the next time the U15 research universities walk in the door with yet another scheme to concentrate research funding.


One Response
That last paragraph is interesting, but it brings us back to the question raised earlier, about whether citation metrics really measure research. Maybe the way in which the Australian and Dutch systems concentrate on producing precisely what gets measured is what gives them a good measure.
One wonders, however, what is not being investigated as a result of this central planning. Or to put it otherwise, if central planning worked, I’d be writing this comment in Russian.