


This year’s regular data release from the Financial Information of Universities and Colleges was delayed by about three months this year due to the pandemic, but it was released late last week. (This data does not actually include community colleges – that’s a separate survey that doesn’t get published for another few months, so sorry in advance for the university-centric material) As usual, I have a two-parter today and tomorrow to discuss the results, one on income and one on expenditure.
(But wait a minute, Alex. If FIUC only dropped last week, how did you manage to do that analysis on institutional finances in the State of Post-Secondary Education in Canada (SPEC) 2020 a few weeks ago? Good question. The answer is: the analysis on university expenditures was the same as it was the previous year because no extra data was available. What I did do, however, was look at the 2018-19 financial statements of every single university with over $50m in turnover – which is as near enough to all of them as makes no odds – in order to get high-level figures like total income, government income, and student income. Turns out there are some interesting discrepancies between what universities report in their financial statements and what they tell Statscan. I’ll get to that in the final paragraphs.)
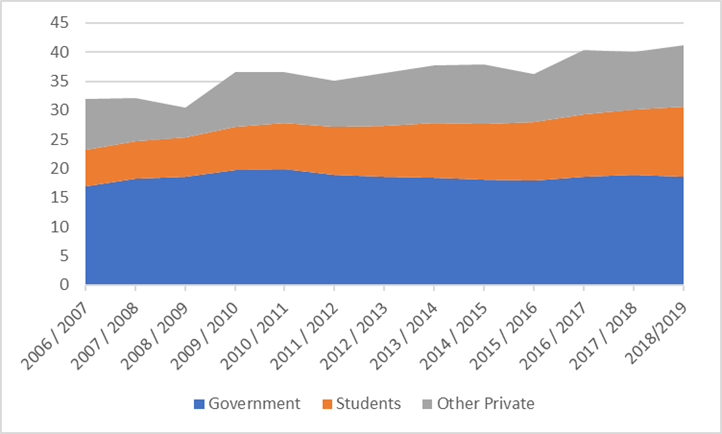
So the basic story is similar to any of the last ten years or so: total funding from government been flat or falling slightly in real terms for more than a decade now (this includes both federal and provincial dollars, with the latter accounting for 75-80% of total). That’s the bad news. The good news – if you’re a university – is that total income has kept rising at an average of about 2% year after inflation, thanks to increased self-generated income and (especially) much higher income from student fees, thanks to the influx of international students.
Figure 1: Total Canadian University Income by Source, in Billions of $2018, 2006-07 to 2018-19
Now, the two biggest and most important sources of income – by far – are provincial government funds and tuition fees: together these make up something pretty close to 100% of the operating budget. Figure 2 shows the real increase in both of these sources of funds over the past one, five and ten years. There is, simply, no comparison between what is happening in the two sources of income.
Figure 2: Change in Universities’ Real Income from Provincial Governments and Student Fees over 1, 5, and 10 years, Canada, 2018-19

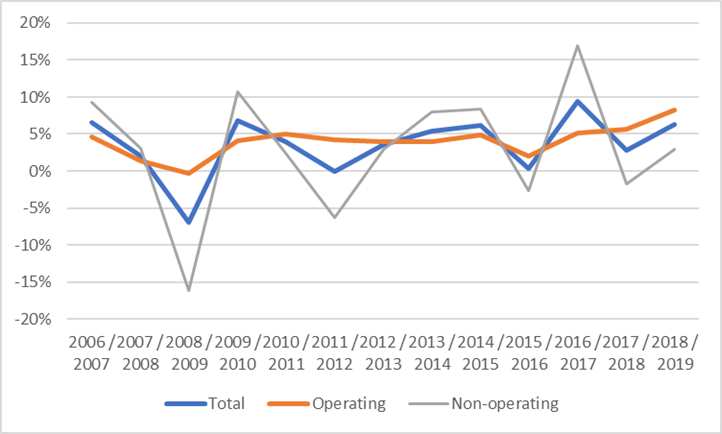
So how financially healthy are universities? It depends. If you just look at their operating budgets (the orange line on Figure 3 below), then they are looking pretty good: in general, universities have run about a 5% operating surplus most years since the last recession. 2018-19 was particularly, as that margin rose to about 8%. The problem is that the 35-40% of the budget that is not “operations” – all the stuff funded by federal research money, or capital grants from one or both levels of government, or donations, grants and investments. That line bounces around like a ping-pong ball. In about one year out of three, these funds/expenditures are in the red, which also tends to make total budgets float around quite a bit as well. Still, overall, overall budgets tend to average about a 4% surplus, and 2018-19 was a little bit above average at 6%.
Figure 3: Surplus in Total, Operating and Non-Operating Budgets, Canadian Universities, 2006-07 to 2018-19
(One thing that happened when in SPEC 2020 I plotted institutions against their stated financial position, I did get a few people from institutions saying, “but our operating budget is in surplus!” Which, ok, possibly, but virtually no one puts out financial statements which distinguish between total spending and operating spending, so that’s impossible to discern from the outside. Nor, I suspect, would a government necessarily care if it even came time for a bailout.)
One last inside-baseball point here. In SPEC this year, I tried to make institutional financial statements – specifically the reports of income by type – stand in for FIUC this year because of the COVID-related delay (on the whole I would have preferred not to spend my July weekends chasing up this kind of data institution by institution). I was pretty sure these two sets of numbers would not be exactly the same, mainly because at big universities the financial statements don’t include what FIUC refers to as “entities non-consolidated” (which, as I understand it, mainly includes research money that flows through teaching hospitals). But now that the FIUC numbers are out, I am surprised at the extent to which the two numbers differ. Fee income gets reported pretty similarly across the board, but universities do seem to report government income somewhat differently to FIUC than they do in their financial statements. At some institutions, the difference can be as high as 10%. It’s not clear to me why this might be the case, but in any event, it turns out the FIUC records growth in both government and total revenue in 2018-19 as being about one percentage-point lower than what institutions’ financial statements would lead you to believe.
Tomorrow: expenditures.

