


Yesterday, Statistics Canada did the last of its big data dumps on the 2016 census and it covered education. As usual, the HESA Towers team swung into action to get you the highlights (no, really, today was a big team effort, Jonathan W. and Robert B. did extra duty to get you this post today).
Now, census data isn’t usually something that drives big headlines. You usually have plenty of notice about things like “people getting more educated than they used to”, so the census isn’t a big source of surprises unless something really bad happens in data processing. For instance, there’s that famous story (possibly apocryphal, I’m not vouching for its veracity) about how a coding error in the 1971 census led Statscan to report the existence of over 1,000 Yiddish-speaking Inuit in Canada.
So, the overall data is kind of dull, you can go here to see how Statscan presents the data. But I though it would be interesting to focus on three specific data points.
The first has to do with attainment rates at college and university levels. If you look at figure 1, what you see is a pattern of stagnant or even declining college attainment rates and rising university attainment rates. That seems significant, but some interpretive caution is in order here.
Figure 1. Attainment rates by age and highest credential obtained, Census 2001-2016.
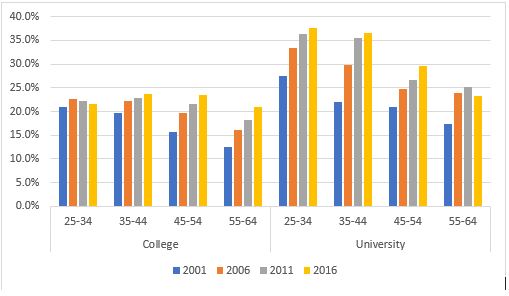
The use of the term “highest credential obtained” needs to be interpreted carefully, as pretty much anyone in the colleges and polytechnics sector will tell you (Hi, Nobina!). If you went to college and then went to a university to find a program, you get listed as having “university” as your highest credential. But if you finished university and then went to a college to get one of those increasingly common post-degree certificates that colleges offer? You still get listed as having university as your highest credential.
For instance, a higher college completion rate in Quebec may not result in higher “college attainment rates” if more people then finish university, too. And that is in fact what we find – a lot of the “drop” nationally is situated in Quebec, and what that really means is not that a lower proportion of Quebecers are finishing CEGEP, it means a larger proportion are then completing university degrees.
Basically, the census is not a very good way to look at attainment. Also worth considering–this is about attainment anywhere rather than attainment in Canada. Since immigrants are more likely to have attended university than college (most major source immigration countries have pretty tiny college sectors), that will moderately boost the numbers. So, yes, it’s a finding of note, but it may not mean a great deal. It would be helpful if the census changed the question to allow multiple answers concerning the question of credentials in order to improve our understanding of post-secondary credentials.
The second big finding concerns gender. And this is a big one, because here we see that the gap between 25 to 34-year-old men and women has never been higher. The gap at the college level is 4.9%, while at the university level it is 12.5%. Combined, 67.9% of women aged 25-34 have a PSE credential compared to just 50.5% of men. That’s a 17.4 percentage point gap, compared to just 11.6% back in 2001.
Figure 2: Attainment rates by gender and highest credential obtained 25-34 year olds, Census 2001 through 2016.
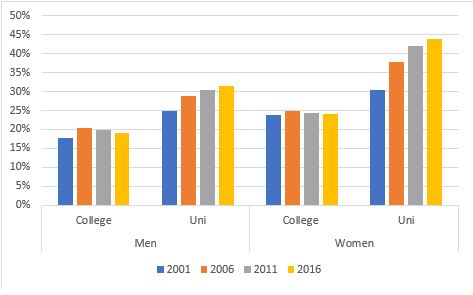
This increasing gap does seem to be a long-term trend, but it’s also worth remembering that attainment rates of 25-34 year olds in 2016 largely reflect educational decisions made in the mid-to-late 2000s, when high commodity prices made non-PSE outcomes for males looked a heck of a lot better than they do today. But this is one of those short-term smart, long-term-not-so-smart things: young men who earned big money in resources ten years ago are missing out on job opportunities now.
The final piece of news here – and it’s not good – concerns Indigenous attainment rates which are shown in figure 3.
Figure 3: Attainment rates by Indigenous status and highest credential obtained 25-34 year olds, Census 2006 through 2016.
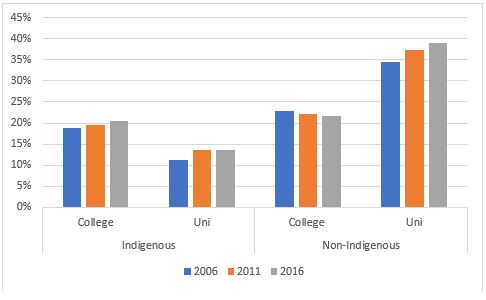
The good news in figure 3 is that the college attainment gap between Indigenous and non-Indigenous Canadians has dropped to just one percentage point. The bad news is that the gap on the university side is now over 25 percentage points, or about 3:1 in favour of non-Indigenous people. And this is probably an over-estimate for the Indigenous population as a whole because the census does not really count on-reserve populations, which tend to have lower attainment rates.
This result contradicts some of what people are seeing and hearing on campuses in terms of higher Indigenous participation rates in recent years, there are three possible explanations. The first is that to the extent those increases have occurred in the last five years or so, they will barely show up in the attainment figures (because attainment implies graduation). That is to say that both stories may be true, but we won’t see the effect of higher participation really until the next census. The second is that what may be happening is that Indigenous students are more likely to identify as Indigenous to institutions (which would account for an apparent boost in enrolments), but that they have not always been identifying as Indigenous on the census. That would mean that most of the apparent recent boost in numbers have been due to better identification than better actual participation rates. The third is that participation rates are increasing but completions are not. If I had to guess, I would say the first two are more important than the third, but all probably play a role. In any event – this is a file where there is clearly a lot more work for everyone to do.
That’s it. You are now completely up to speed on the census education release. Enjoy the rest of your day.

