

Every couple of years I do a piece looking at how Canadian institutions compare in terms of research output and impact using data from the CWTS Leiden Rankings, which happen to be the most transparent system of bibliometric research rankings out there. It’s that time again.
So, just to remind people what the CWTS Leiden ranking actually is: the good folks who do scientometrics at the University of Leiden annually put together a wide variety of bibliometrics measures for about 1,300 institutions around the world, including 31 in Canada. Each year, the ranking reports the data for the last 4-year period for which full data is available: currently, the most recent period available is for 2018-2021 and the available data goes back to the 2006-2009 period. The ranking is what is known as a “multi-dimensional” ranking, in that it does not create overall ordinal positions, but allows users to compare institutions on a variety of individual metrics.
(Nota bene: up until last fall, the Leiden rankings have used data from Clarivate’s Web of Science database, and this is the source I use for the blog below. However, Leiden has been moving to a new open-source bibliometric system that is quite interesting and which I might write up if I ever get the time. In any event, the point here is: the Leiden folks are the most thorough and ethical in the business and you should pay attention to their results.)
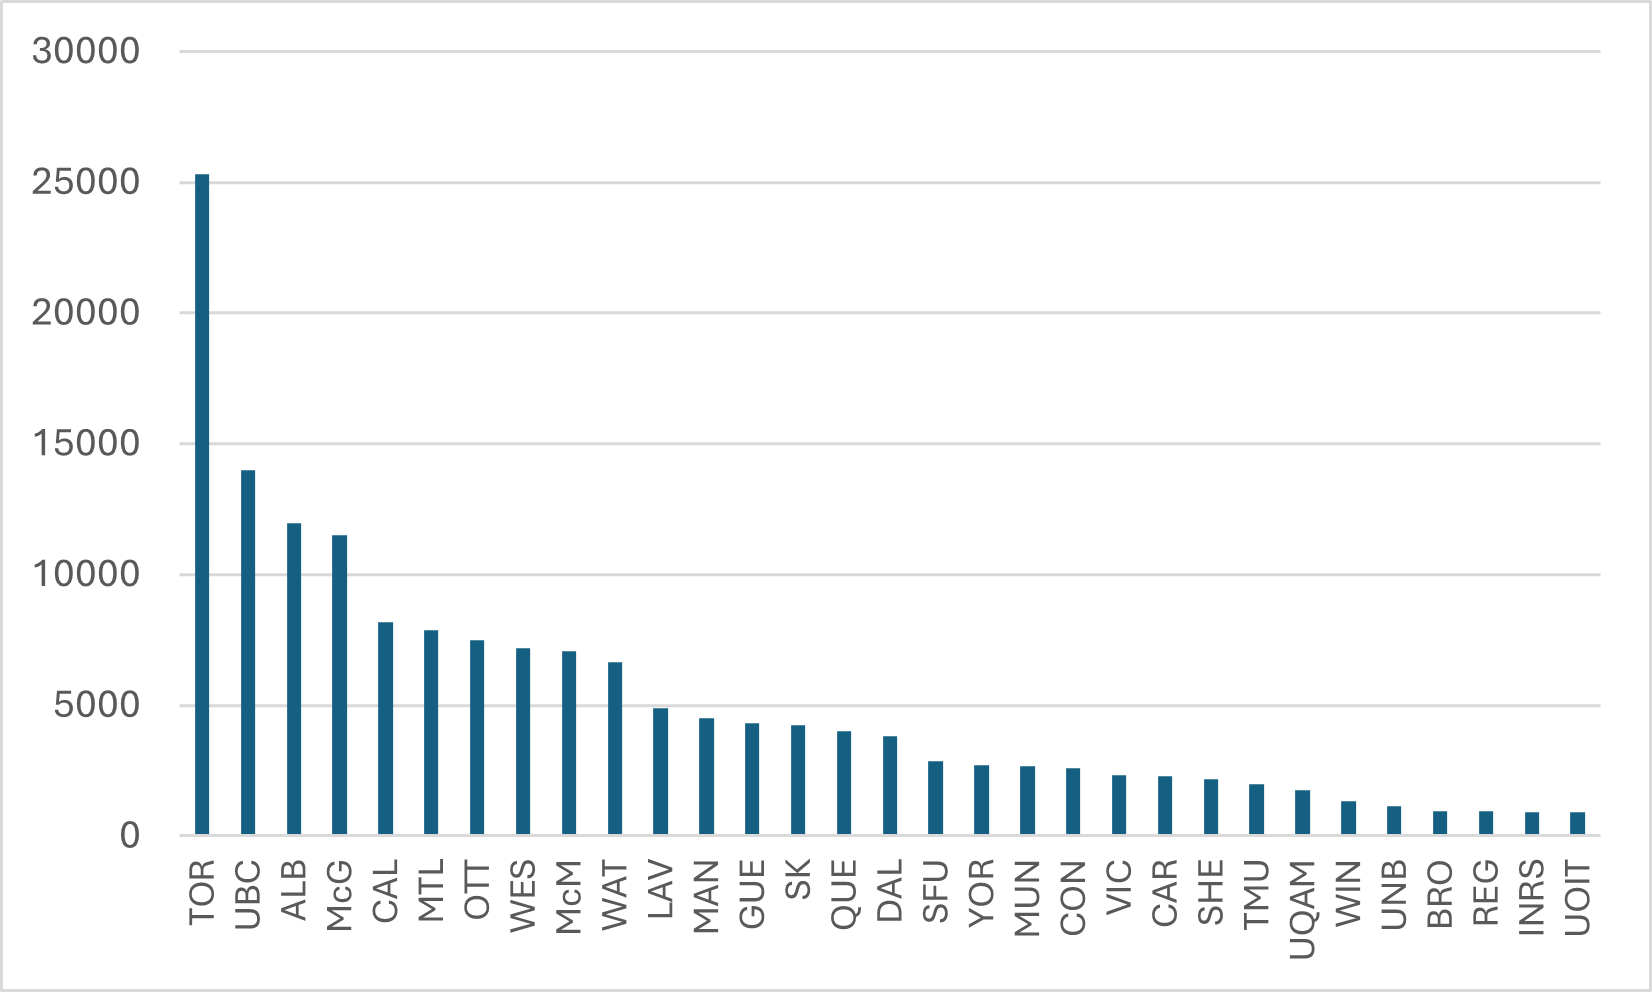
Today, I am going to go over a few highlights from the 2018-2021 data. In figure 1, for instance, I show total publications over the four-year period using a so-called “fractional counting method” (meaning if a paper has two authors from two different institution, each one gets 0.5 of a publication, if it has four authors from four institutions, each gets 0.25, etc). As can clearly be seen, the University of Toronto is in a class by itself. Simply on a raw publication, it is the #5 university in the entire world (behind Harvard and three Chinese universities), with nearly as many as the next two Canadian institutions (UBC and Alberta) combined.
Figure 1: Total Publications, Fractionally Counted 2018-21
But output is just one way to measure institutional performance. The other way to do this is to look at impact in terms of citations. One way the Leiden rankings do this is by calculating a “Mean Normalized Citation Score” or MNCS. Effectively, this measures the number of citations each paper from a university receives, relative to the average number of citations papers in similar fields receive around the world (Leiden calculates averages for over 400 different academic fields, so this is a pretty reliable calculation). The average paper from the University of Toronto has an MNCS of 1.2, meaning it is 20% more cited than the global average. McGill, UBC, and McMaster have similarly high numbers. Most of the francophone Quebec numbers are on the low side, which is probably indicative of the fact that papers in languages other than English (which make up a non-trivial portion of papers at these institutions) are at something of a disadvantage when comparing impact in this manner. More interesting, though, is that the big “flagship” Prairie universities—Alberta, Manitoba, and Saskatchewan—do significantly less well on this measure than they do on raw output measures like publications while non-flagship universities like Calgary and Regina look pretty good.
Figure 2: Mean Normalized Citation Scores, 2018-2021
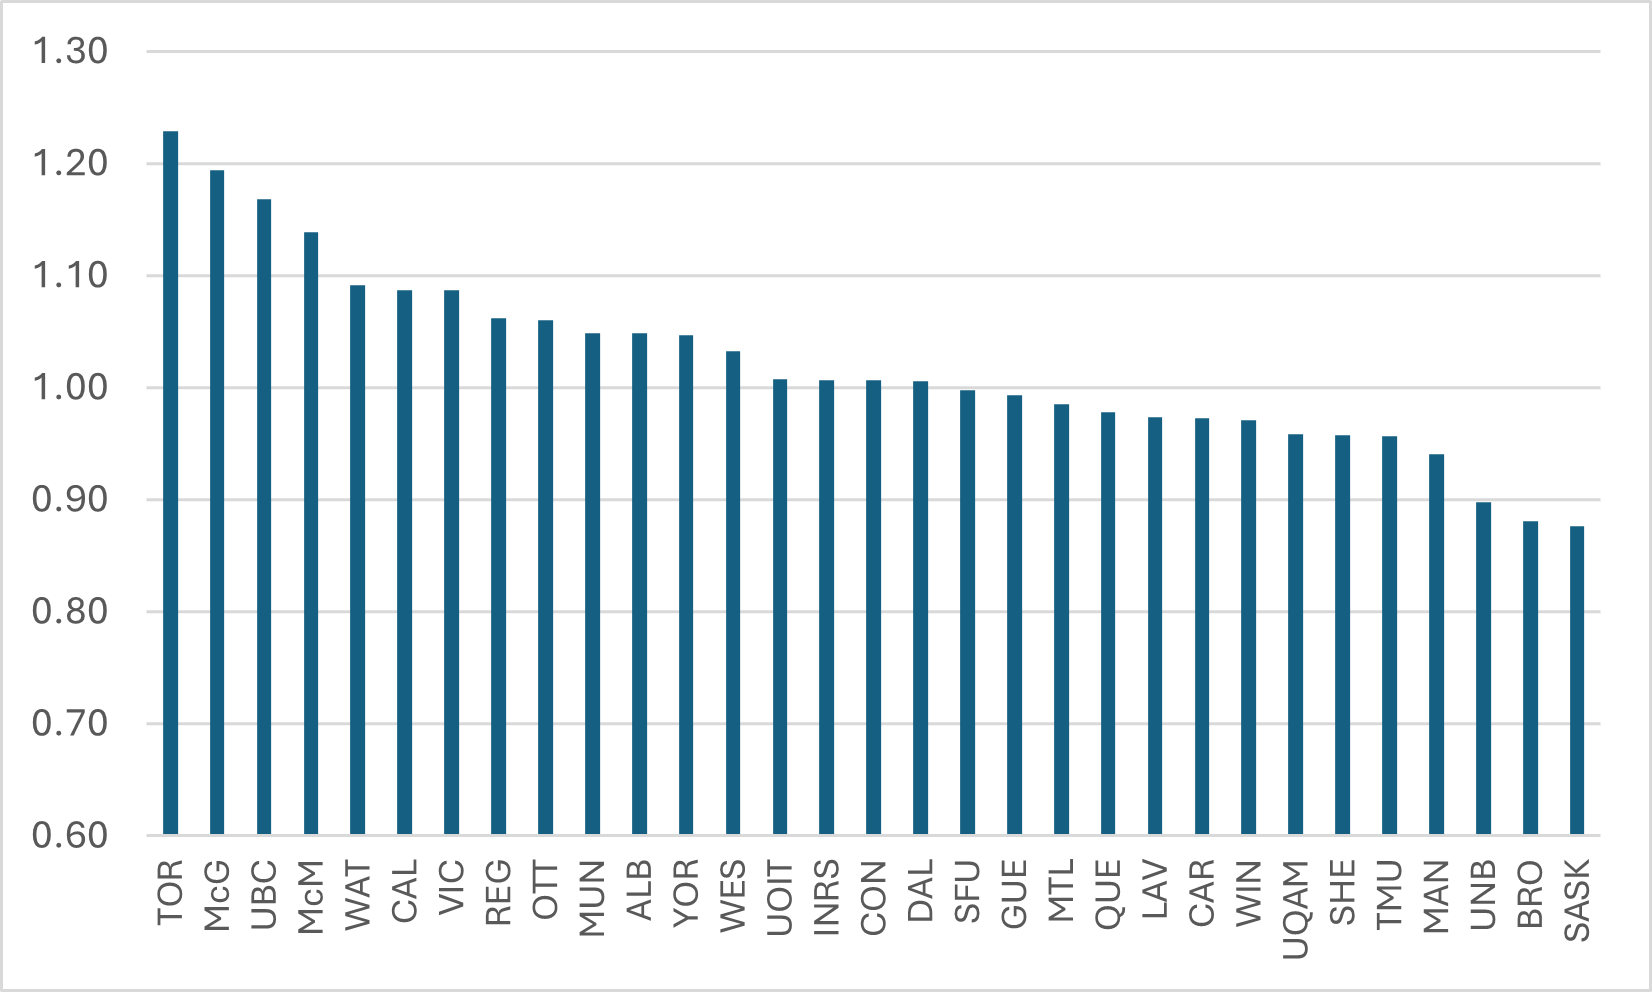
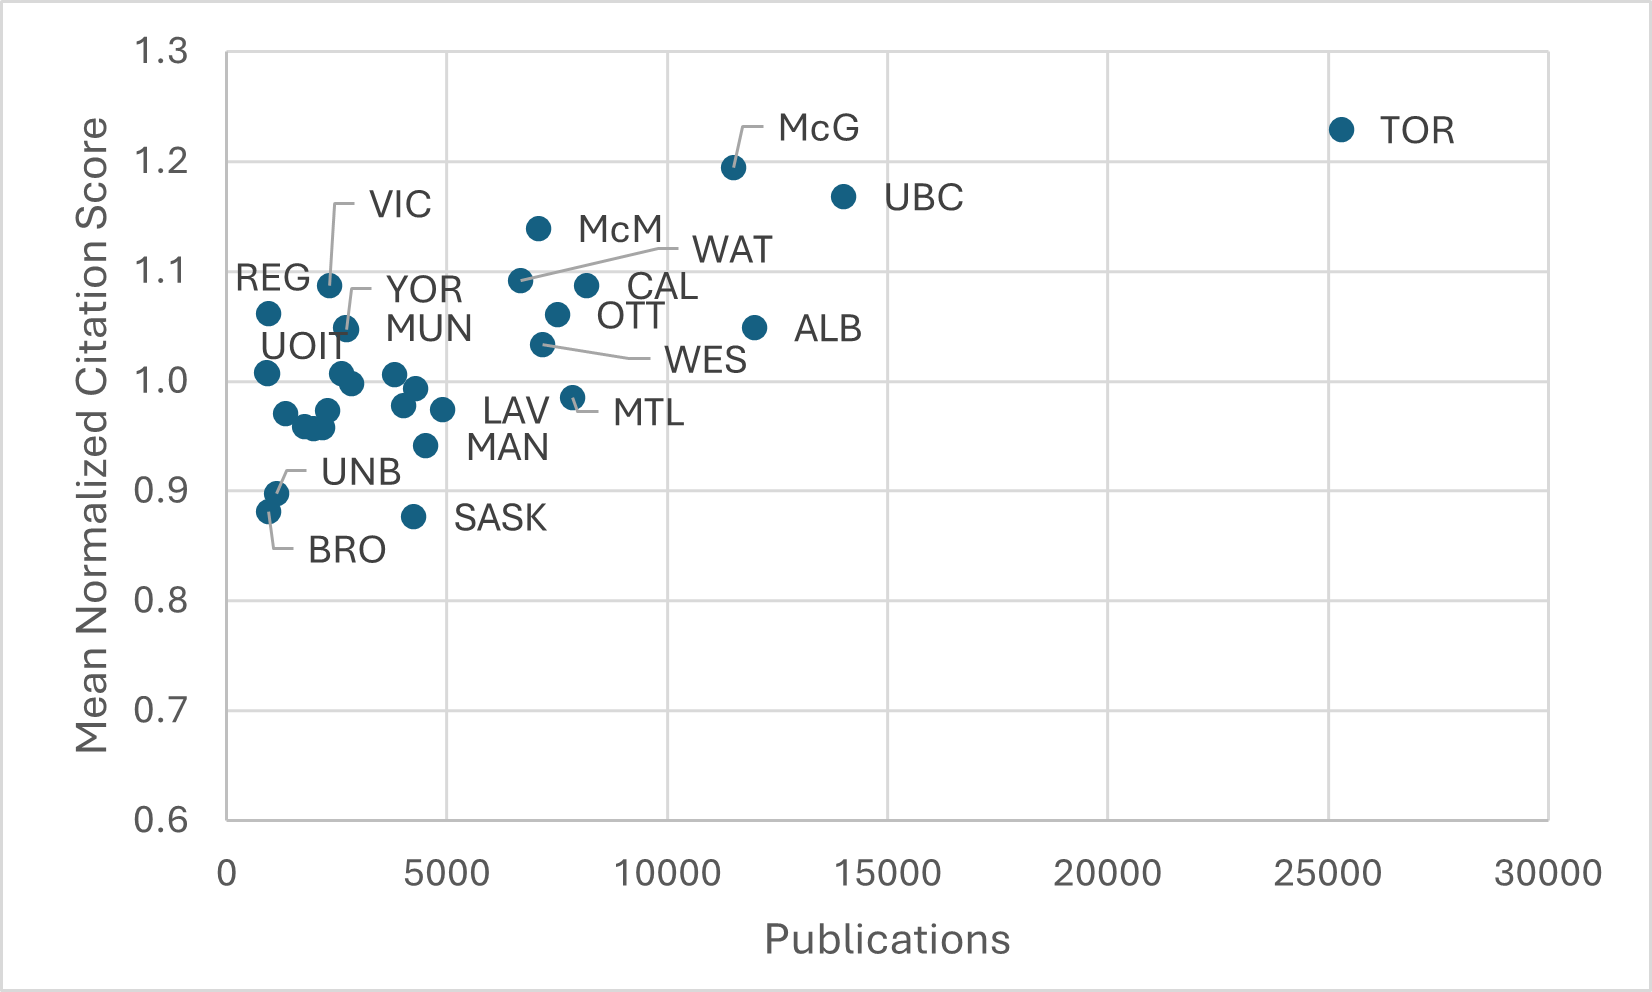
Figure 3 combines the data in figures 1 and 2 to create a single scatterplot showing both output and impact. This figure makes clear Toronto’s pre-eminence on both measures, as well as UBC and McGill’s obvious claims to #2 and #3. But who is #4? Alberta might try to claim it base on its raw output, but its lower MNCS score weakens the claim. One might equally try to give that position to McMaster based on a higher MNCS and lower publication output. Either way, Calgary would then seem to have a reasonable claim to position #6, with Waterloo, Ottawa, Western, and Montreal rounding out a natural top-10.
Figure 3: Publications vs, Mean Normalized Citation Scores, 2018-2021
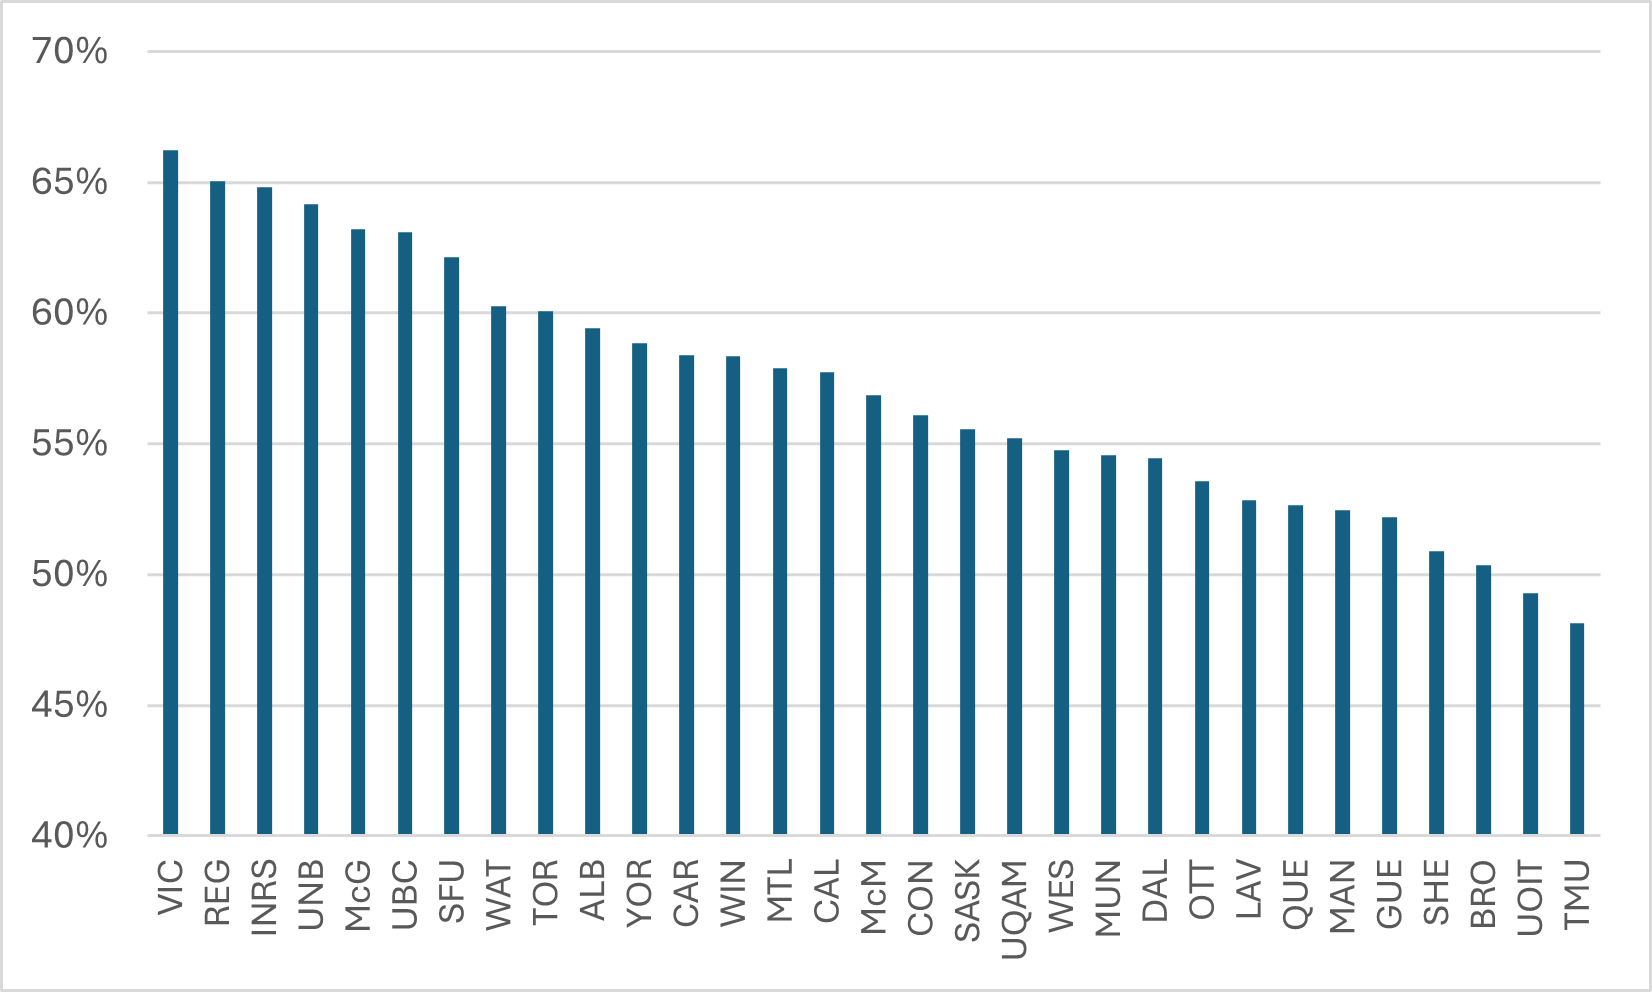
One interesting measure in the Leiden data is the percentage of papers with an international co-author. You might think that this indicator would be dominated by the usual U15 powerhouses but Figure 4 shows that in fact this is not the case: the top four institutions on this measure are the University of Victoria, the University of Regina, the Institut National de Recherche Scientifique (INRS), and the University of New Brunswick, with McGill coming fifth.
Figure 4: Percentage of Papers with an International co-author, 2018-2021
Of course, raw publications show one thing, but it’s important also to look at change over time. In total, the measured output of the 31 institutions increased by 41%, (note: it is hard to tell how much of this is a result of increasing journal inclusion over time rather than actual change in output, which is why it is more important to look at change relative to the average). The biggest increase in publications at any Canadian university between the 2006-2009 quadrennium and 2018-21 was at UOIT, where the number of fractionally-counted journal articles increased by over 300% mainly because UOIT was barely in existence in 2006 (I have not included UOIT in figure 5 because frankly they throw off the scale). But the remainder of the top-performing institutions on this measure are an interesting bunch. They include big U15 universities like Alberta and Ottawa, but also Toronto Metropolitan, Memorial, and Concordia. At the bottom end, it is likely that some of the weakest performers (which include Dalhousie, Victora, Queen’s, and UNB) probably experienced a real decrease in publications which is being hidden by the increase in journal inclusion.
Figure 5: Percentage Increase in Publications, 2006-09 to 2018-2021

We can also look at change in impact over time, as we do in Figure 6. TMU again comes top of the table, with Concordia next, followed by a trio of prairie universities including Alberta and (taken in conjunction with Figure 2, it suggests that whatever the problems these universities have punching their weight in terms of impact, they used to be a lot worse). Meanwhile, there are a number of universities, including some big U15s like Queen’s, UBC, Laval, and Montreal, where impact as measured by Mean Normalized Citation Scores are falling.
Figure 6: Percentage Change in Mean Normalized Citation Scores, 2006-2009 to 2018-2021

Figure 7 combines the data in Figures 5 and 6. On the top right of the graph, Toronto Metropolitan stands out as the institution which has by far made the most progress in research output and impact since 2006-09, with Alberta, Memorial, and Concordia also having improved significantly in both areas. University of Montreal and Queen’s stand out as the most important institutions in the bottom left of the graph which have either stagnated or declined over the past fifteen years.
Figure 7: Percentage Change in Publications vs. Percentage in Mean Normalized Citation Scores, 2006-2009 to 2018-2021

 Tweet this post

It would be interesting if these could be indexed for 1. the size of each institution; 2. the spread of disciplines, with their various expectations.
In other words, is UofT really a research powerhouse, or is it just really big and filled with the sorts of scientists who publish tens of articles a year? Is McGill worse, or just smaller and boasting relatively more faculty in fields where a couple of articles a decade is considered perfectly acceptable?