

Morning folks. Today we’re going to look at the province of Newfoundland and Labrador. As I demonstrated here, it is a lot like Alberta in its hydro-carbon related boom-and-bust funding cycles, but quite unlike it in its demographics and student numbers.
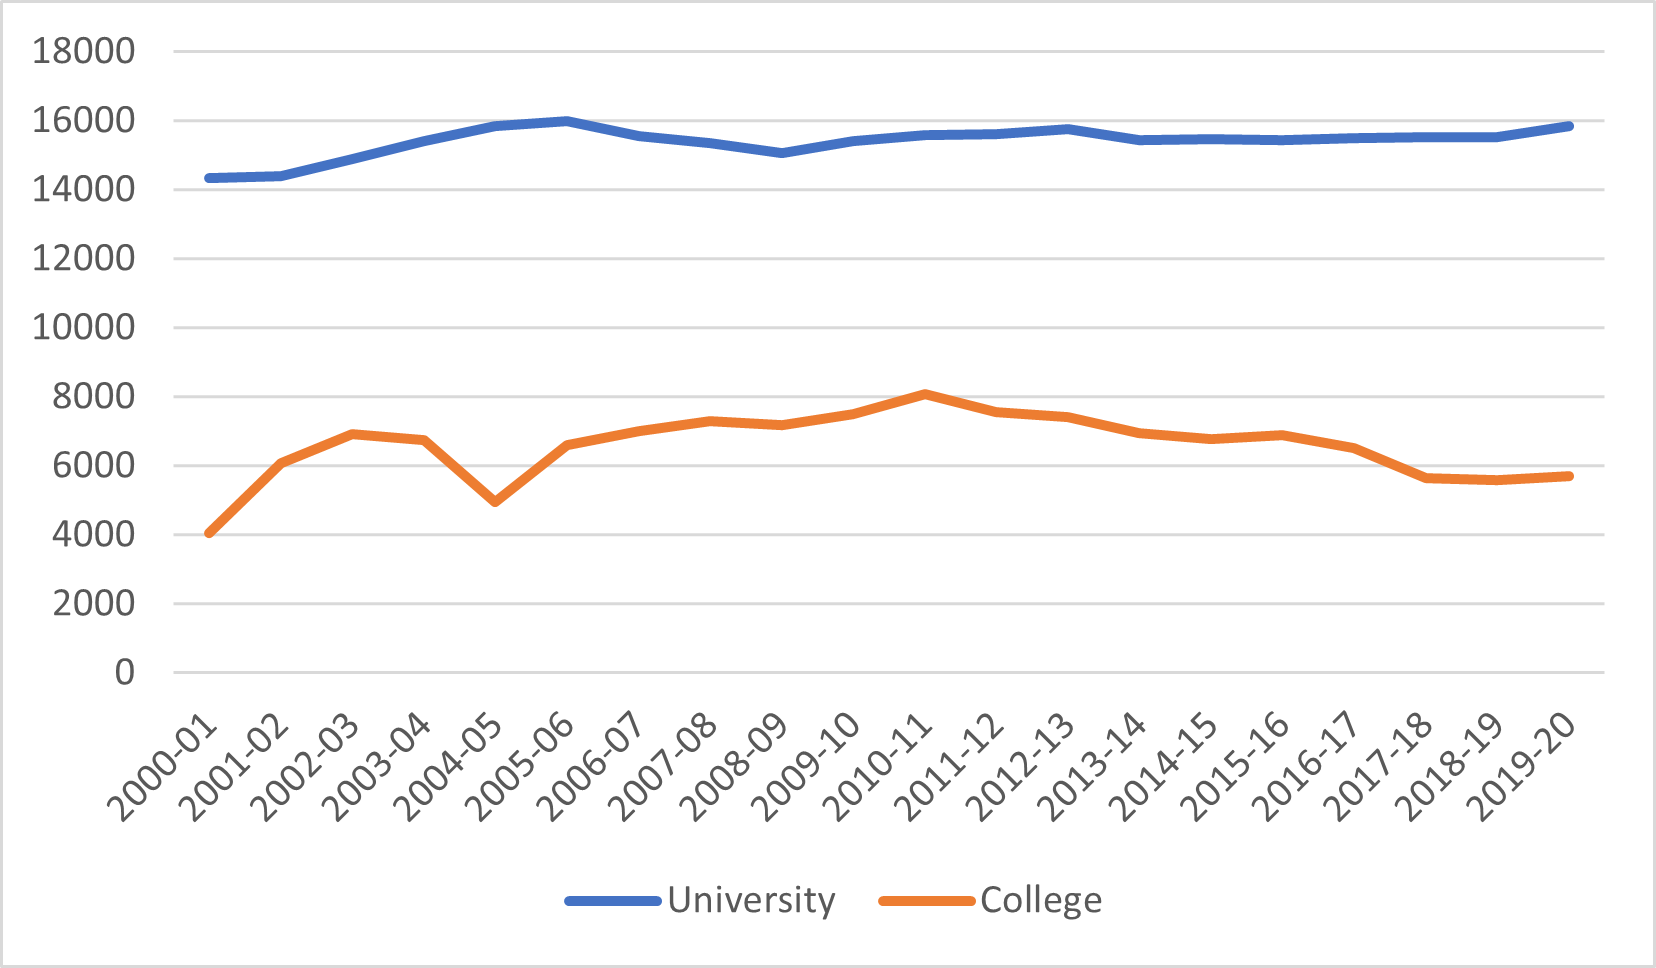
Let’s start with student numbers. Newfoundland and Labrador faced adverse demographics for post-secondary education for decades now, so simply keeping numbers steady is a bit of a triumph. When the government reduced and then froze tuition in 2000, the province’s PSE institutions saw a bump in enrolment; at the university level, that came mostly from reversing the flow of students from the west of the island to Nova Scotia and attracting some students from the Maritimes. Over time, that effect has worn off, though international students have come to replace out-of-province domestic students to keep FTE numbers in the 16,000 range. Meanwhile the province-wide College of the North Atlantic, the institution which probably holds the Canadian record for Most Presidents in a Single Decade, has seen a drop in enrolments of over 30% since 2010.
Figure 1: Full-time Equivalent Students, by Sector, 2000-01 to 2019-20
As Figure 2 shows, Newfoundland and Labrador kept pace with the rest of the country in terms of student numbers from 2000 to about 2008. But since then, numbers have declined (again, mostly due to the college sector) while the rest of the country has increased. Keep this fact in mind when you start looking at government spending figures below.
Figure 2: Indexed Full-Time Equivalent Post-Secondary Students, Newfoundland and Labrador vs Other 9 Provinces, 2000-01 to 2019-20 (2000-01 = 100)
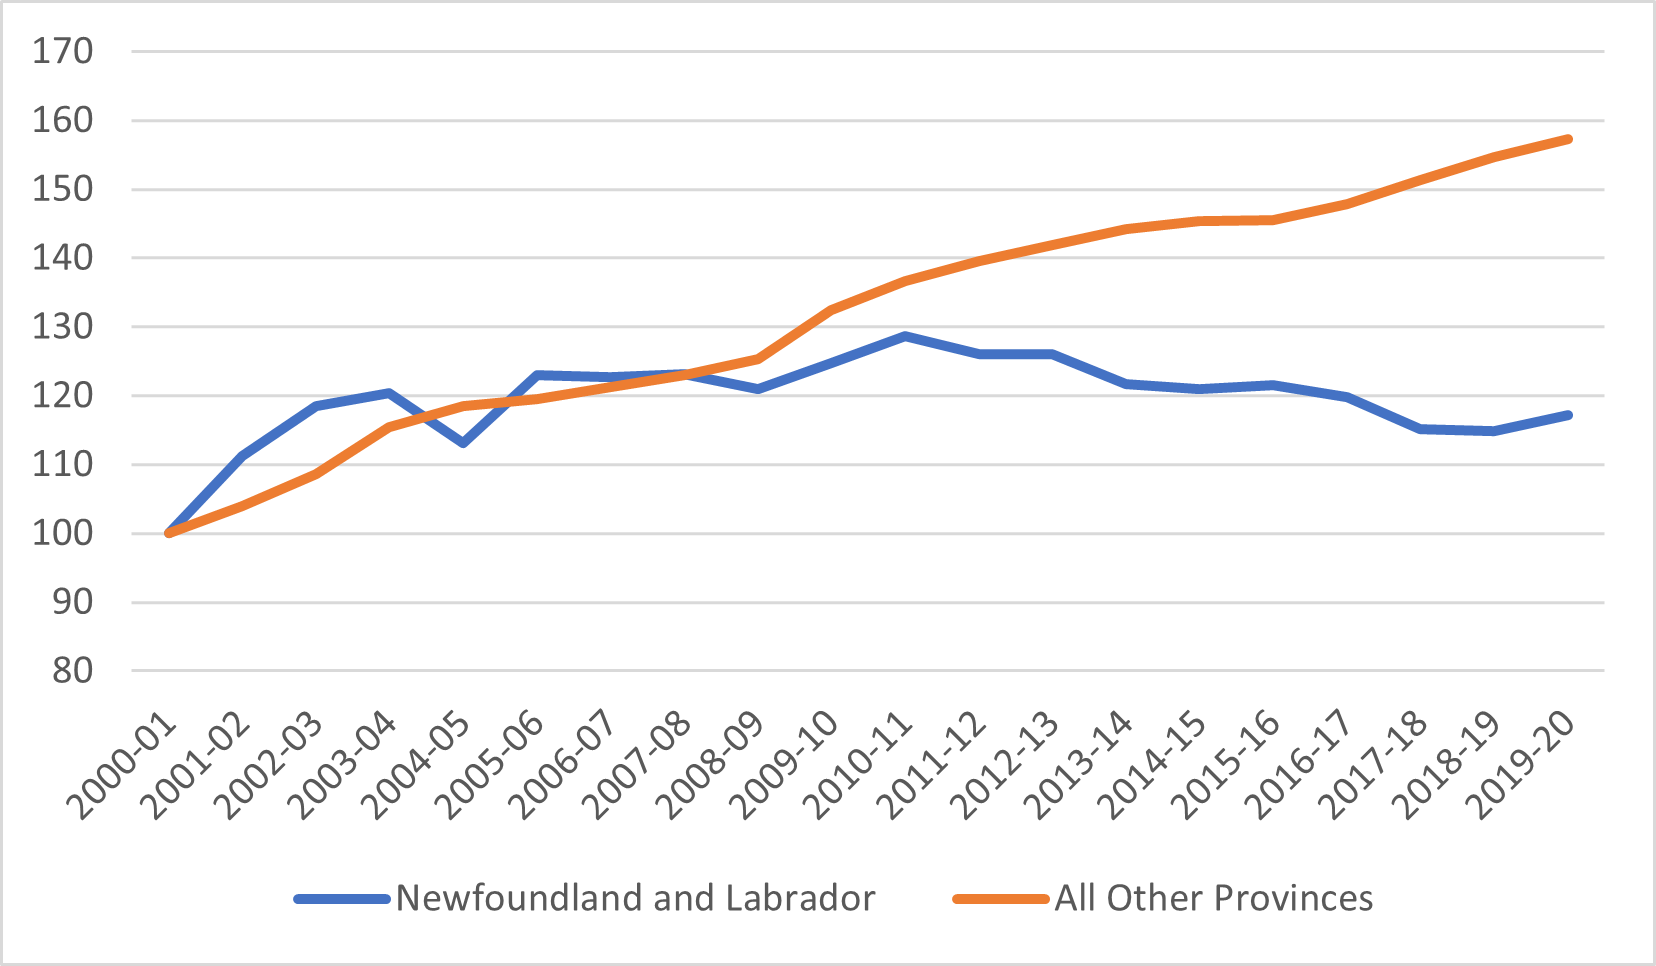
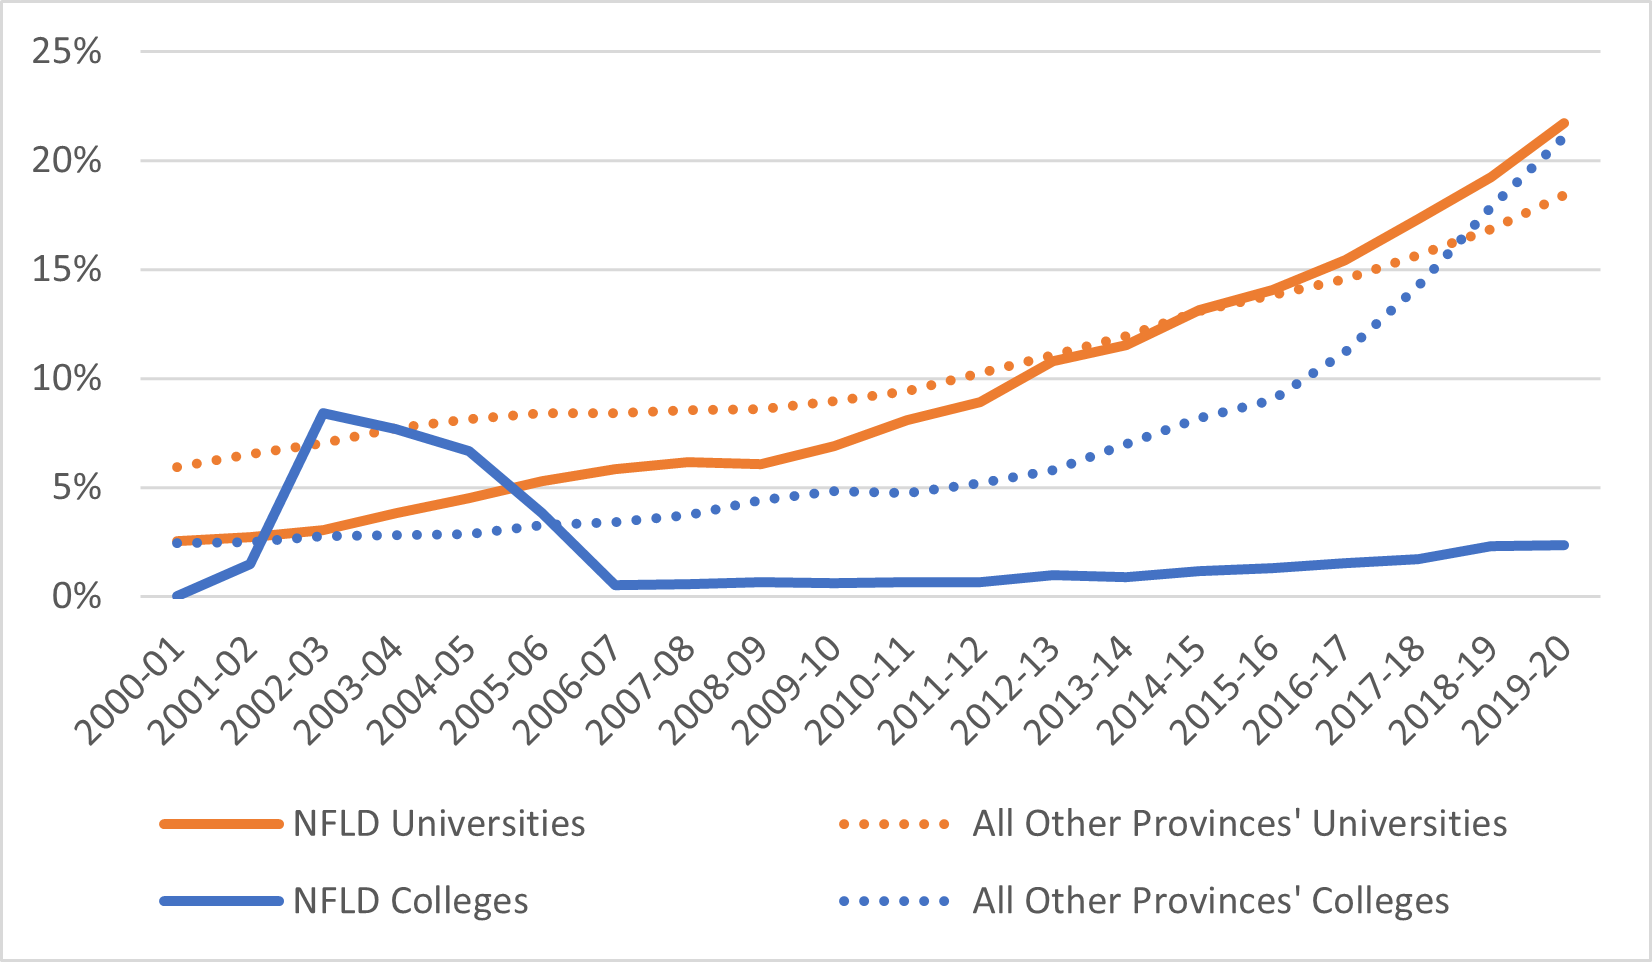
Figure 3 shows international students as a proportion of total enrolments. There are two very different pictures here. On the university side what we see is that the province lagged the rest of the country until about 2008 (this was about the peak year for Canadian out-of-province students) after which it began catching up and then surpassing the national average. Colleges have a big jump in 2001-02 after which it began to fall back to its initial level of “next-to-none”, which is where it has stayed ever since. 2001-02 is, if I am no mistaken, the first year CNA began operating its campus in Doha, and I do wonder if in fact that early bulge is due to counting students from Qatar being temporarily included in the figures.
Figure 3: Proportion of Students from Outside Canada, by Sector, Newfoundland and Labrador vs other 9 provinces, 2000-01 to 2019-20 (2000-01 = 100)
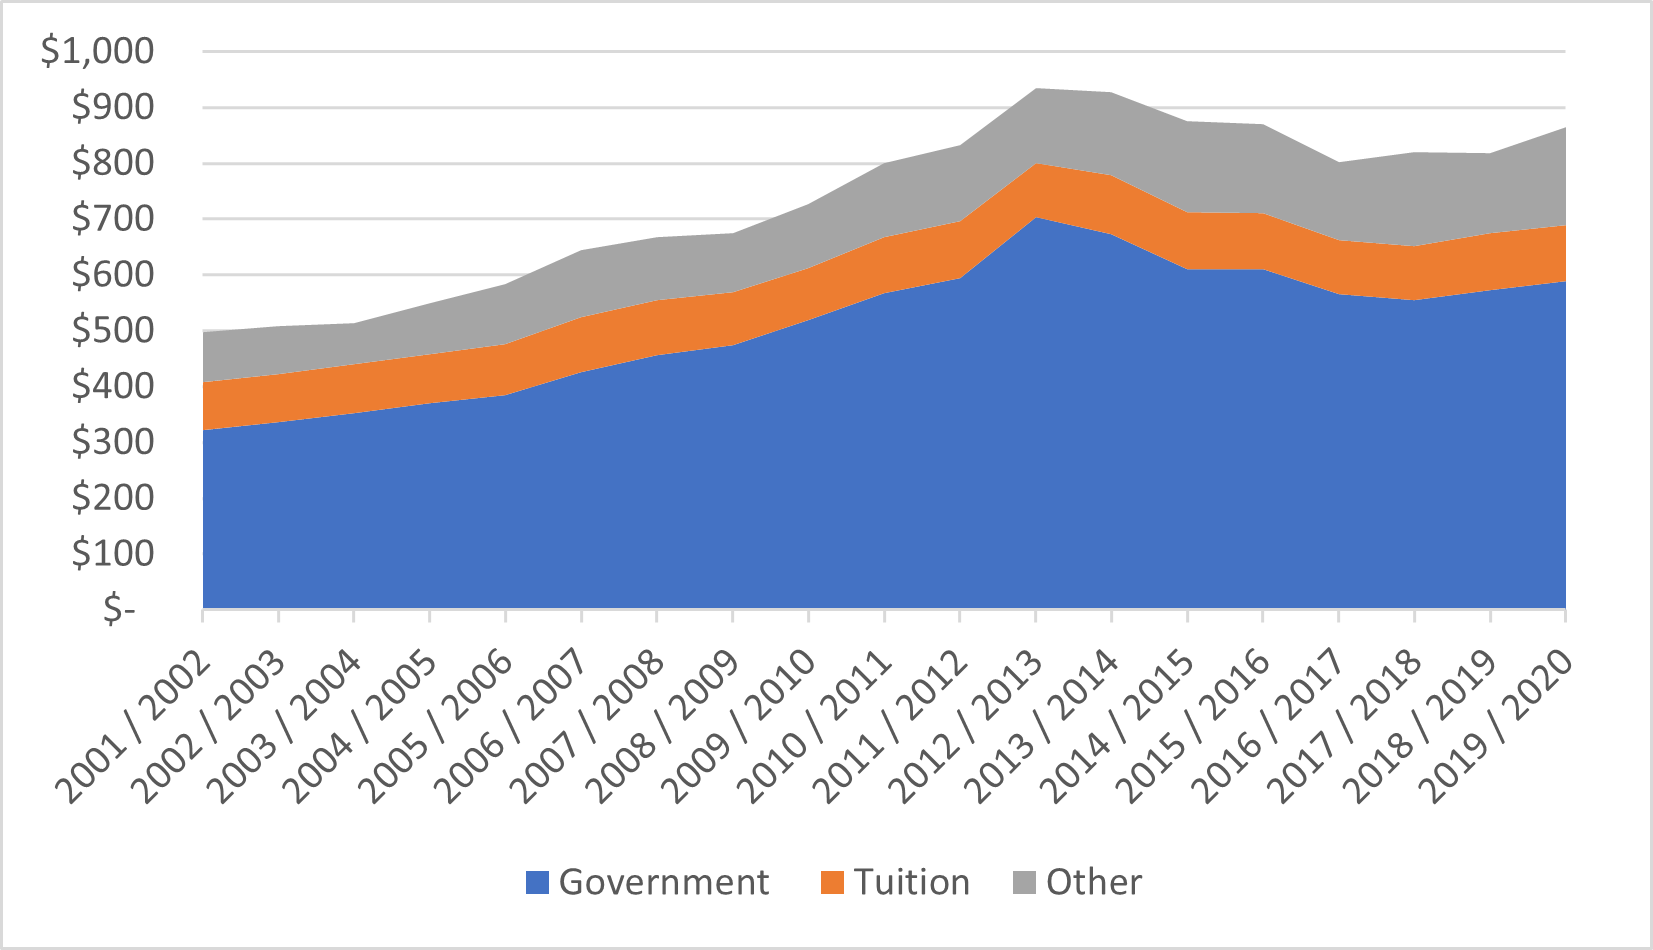
Now, study Figure 4 carefully. Total PSE funding rose by 80% and government funding more than doubled between 2001-02 and 2012-13. And remember, total student numbers only increased by about 25% over that period, so it means that on a per-student basis, institutional income rose by 44% during that period. Pretty stunning. But then the oil money ran out and government began cutting back – by about 21% between 2012-13 and 2017-18. And unlike Alberta, institutions were not able to offset these losses through increases in fee income. The result is that Newfoundland and Labrador’s postsecondary institutes remain much better funded than they were twenty years ago while at the same time they are substantially worse off than they were ten years ago.
Figure 4: Total PSE Institutional Revenue by Source, NL, 2000-01 to 2019-20, in millions of constant $2019
As Figure 5 shows, overall growth in levels of public funding started outpacing that of other governments in Canada more or less in tandem with the run up in oil prices starting in 2004 or so. Even after subsequent cut-backs, the difference in public funding today compared to 2001-02 much higher than in the rest of the country. At the same time, the province’s tuition income has trailed the rest of the country, even though Memorial has outpaced the national average in attracting international students. Why is this? Well, first most students remain domestic students and as Figure 6 shows, tuition in the province lagged far behind the national average because of the province’s tuition freeze policy. But also, Memorial’s fees for international students are nowhere near the national average, so even though they are attracting students from abroad, they are not contributing to institutional fee income the way they are at other institutions.
Figure 5: Indexed Change in Institutional Income from Governments and Tuition Fees, NL v. Other 9 Provinces, 2000-01 to 2019-2020 (2000-01 = 100)
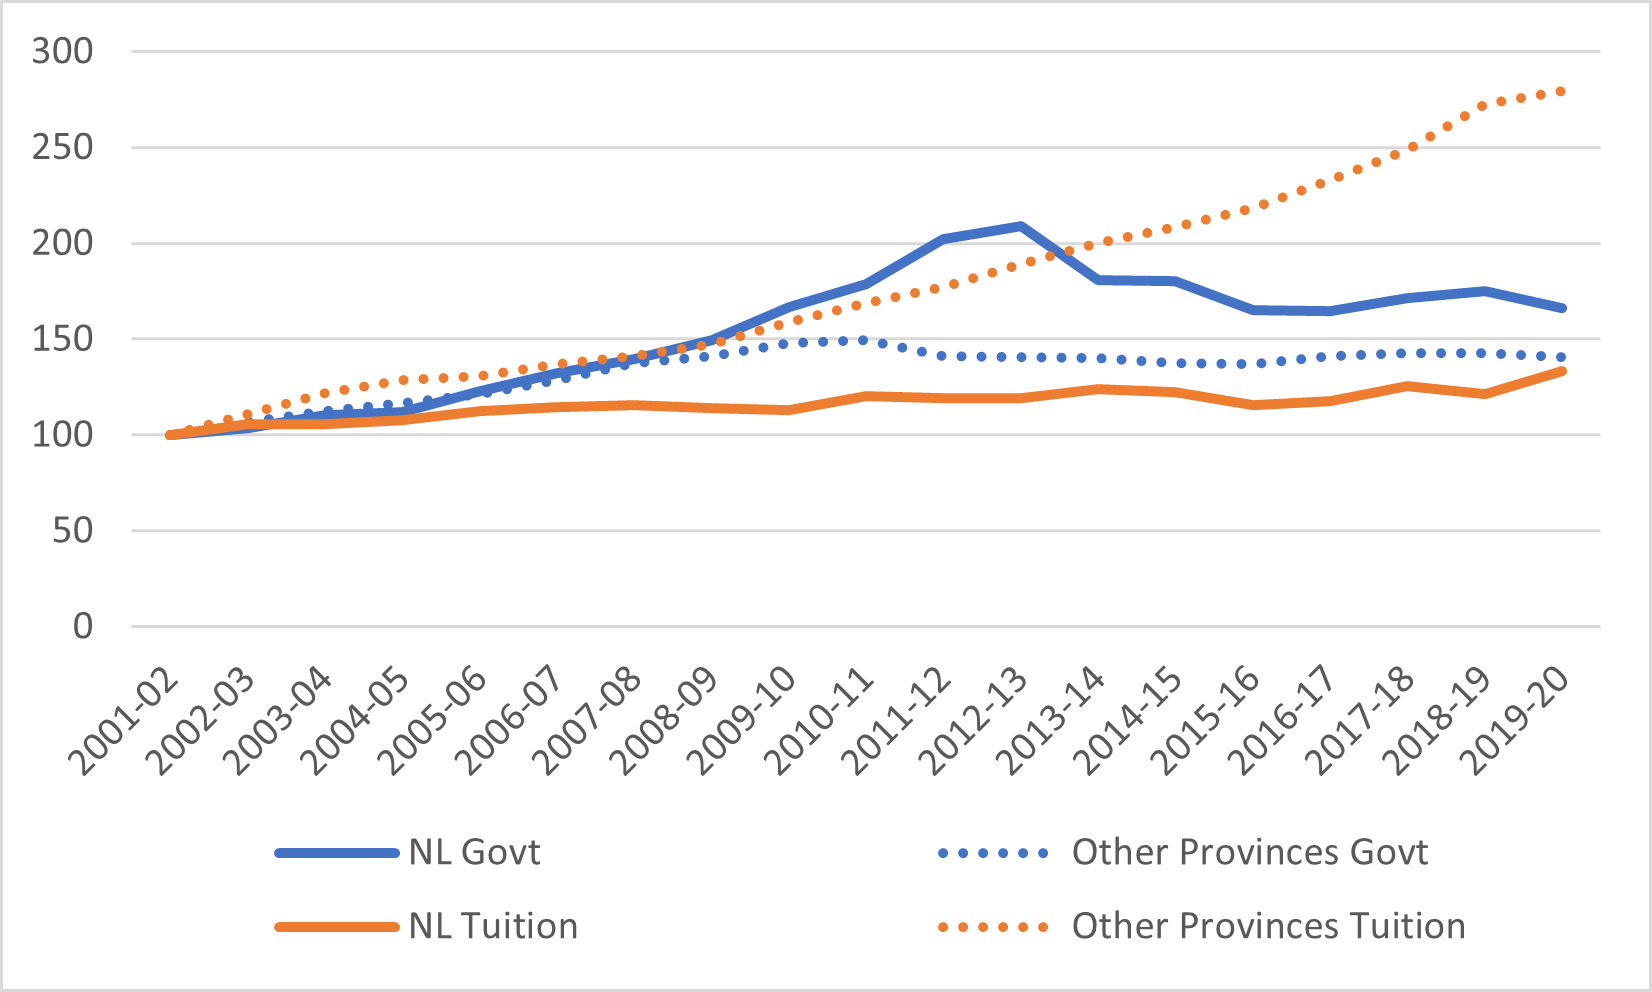
Figure 6: Tuition Fees, NL v. Canada, 2006-07 to 2021-22 (in constant $2021)
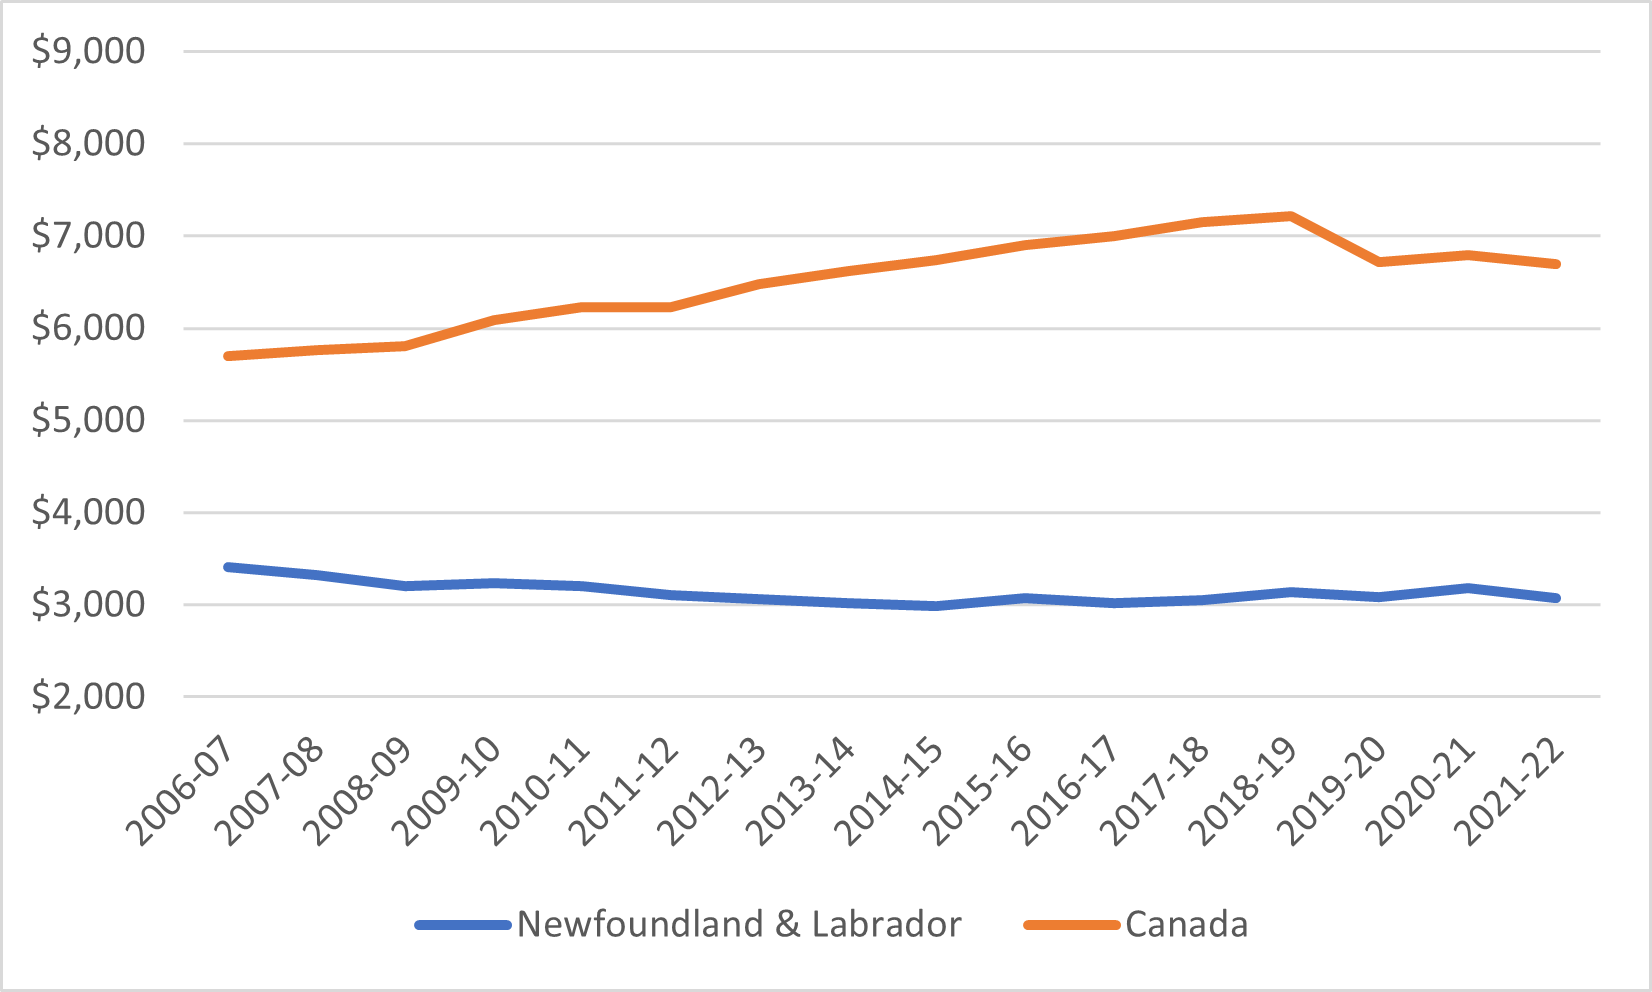
Figure 7 shows the average loan per recipient plus average grant per recipient over time in Newfoundland and Labrador, from both provincial and federal sources (this is not quite the same as an average aid package because not all loan recipients also receive grants). On the whole, aid packages in the province are somewhat smaller than they are elsewhere mainly because lower tuition fees equal lower need equal lower aid. However, the mix of loans and non-repayable aid is like most other provinces at 75-25%.
Figure 7: Average Loan Plus Average Grant Disbursed, NL, 2011-12 to 2019-20, in constant $2019
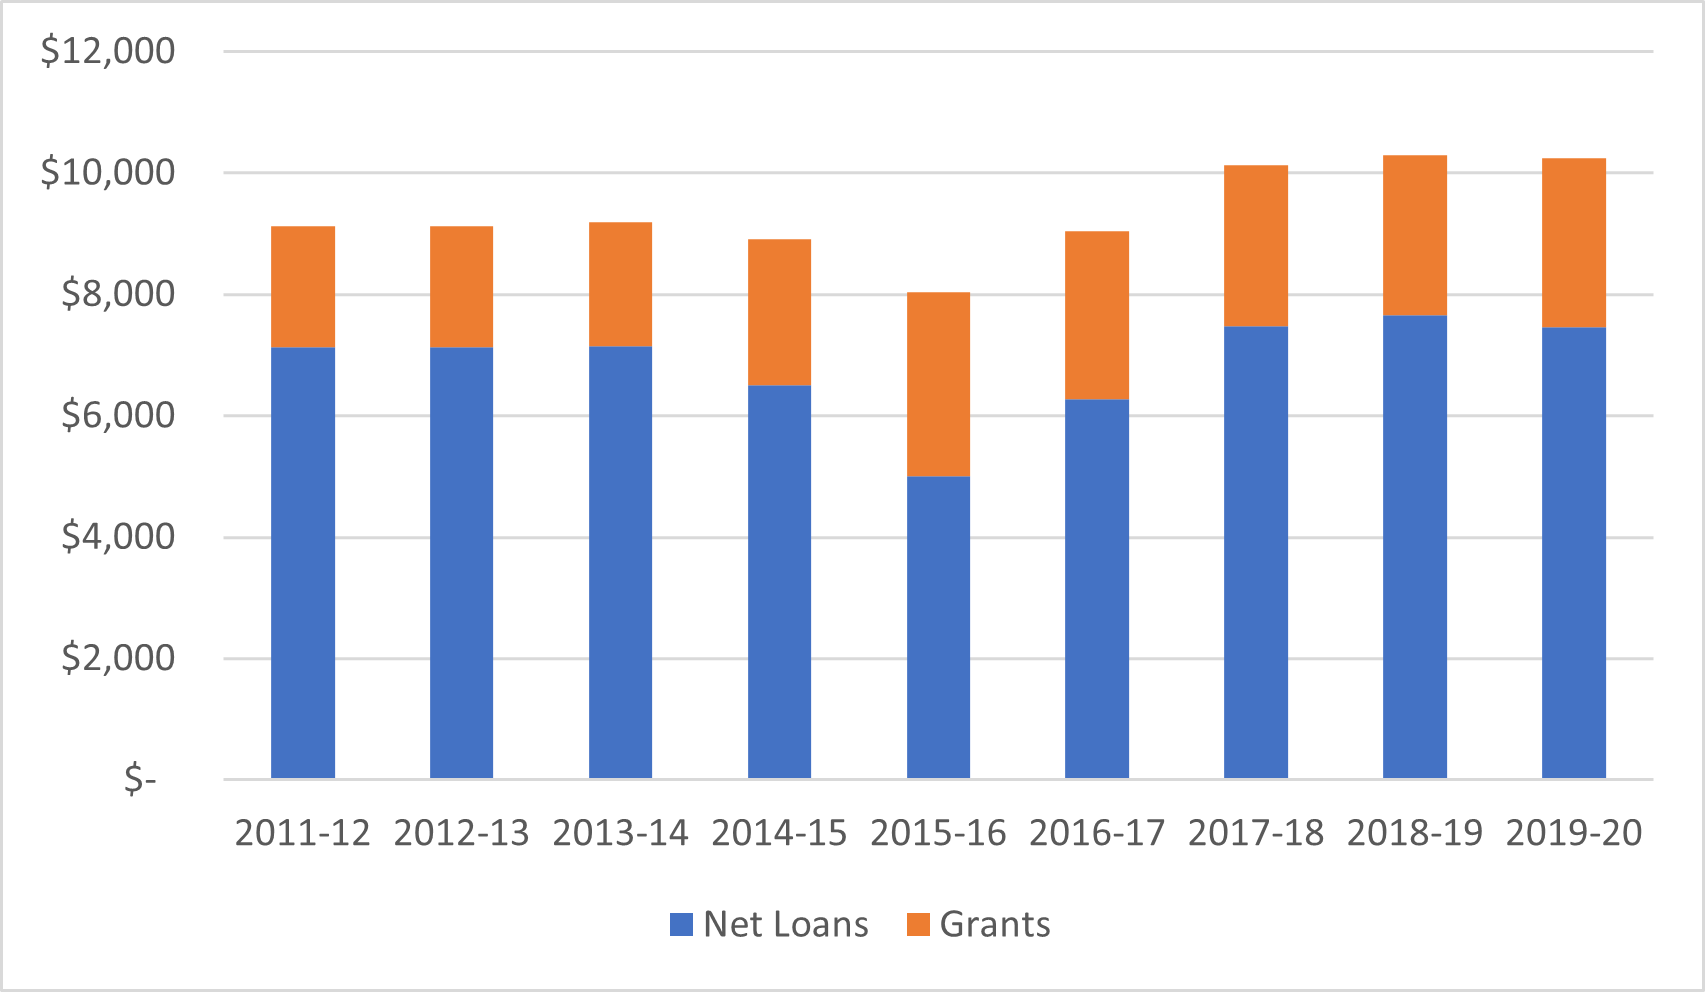
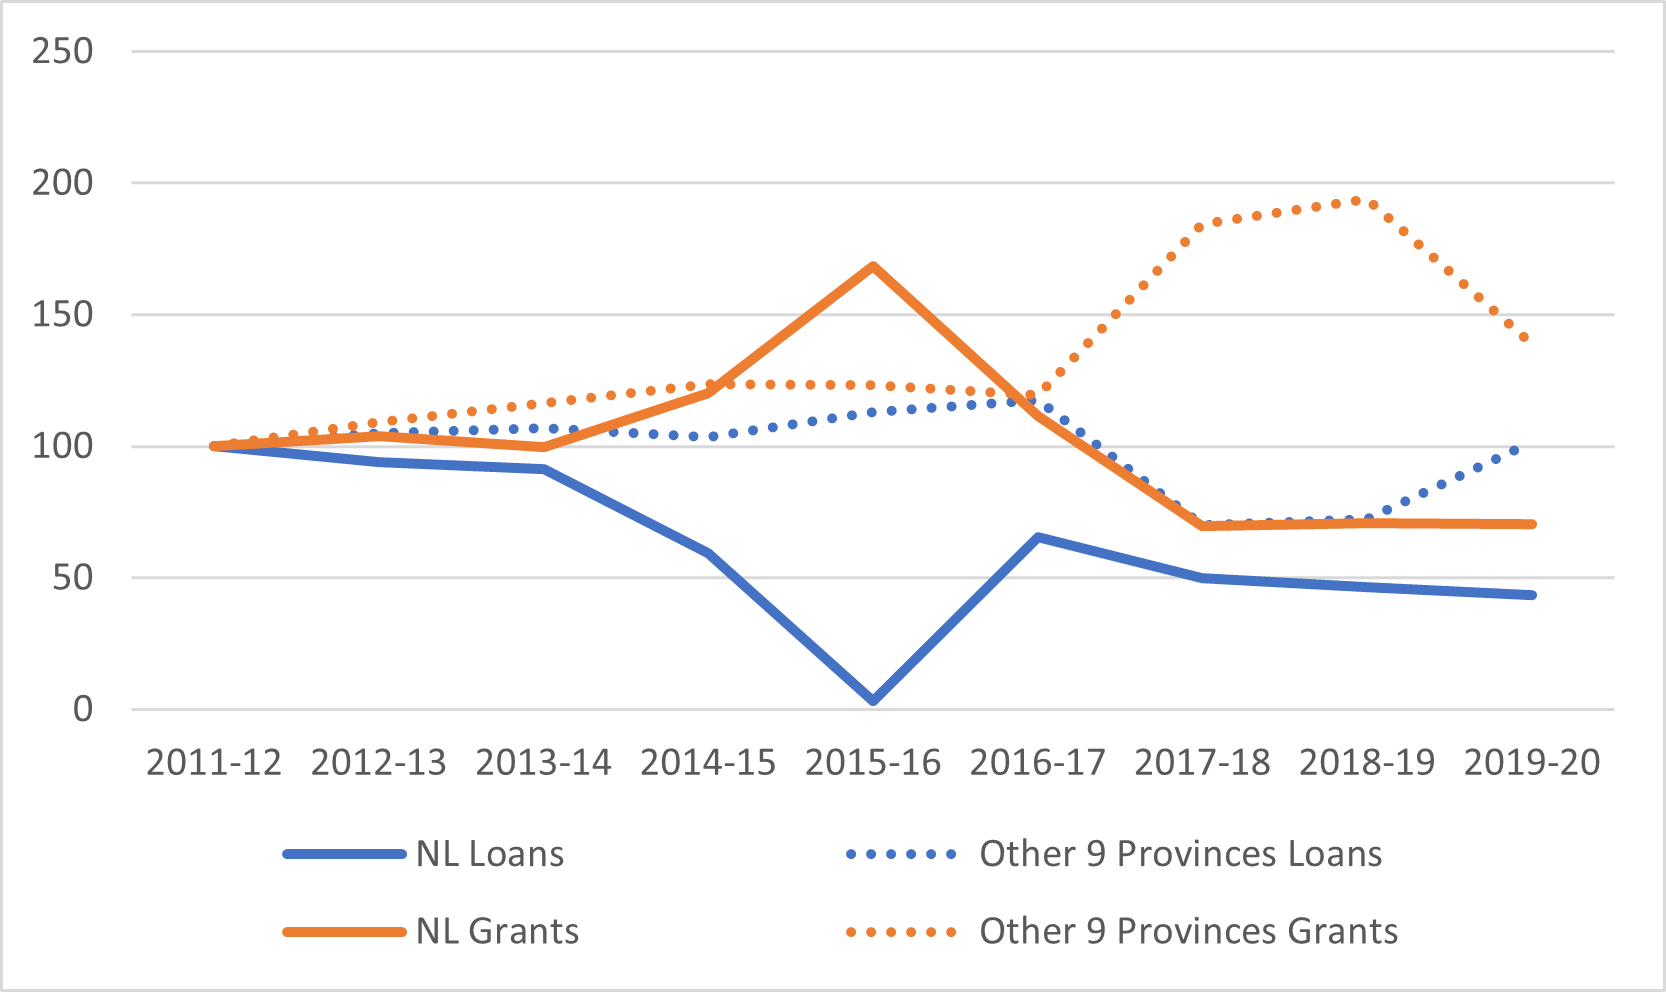
Figure 8, which looks specifically at the provincial portion of student aid, shows that there was a massive reduction in both provincial non-repayable aid (i.e. grants and loan remission) and in loans. The former dropped by a third between 2011-12 and 2019-20, a victim of general cutbacks; the latter fell by a half, mainly because the province decided to copy Nova Scotia’s trick of ignoring federal rules on displacement to push more clients on the federal book instead of the provincial one. I am very unclear about what happened in the big one-year shift in 2015-16; I assume it had something to do with the larger policy change and the fact that loan years and fiscal years don’t line up, leading to a big one-time payment of some kind.
Figure 8: Indexed Change in Total Real Provincial Loans and Grants Disbursed, NL vs. Other 9 Provinces, 2011-12 to 2019-20 (2011-12 = 100)
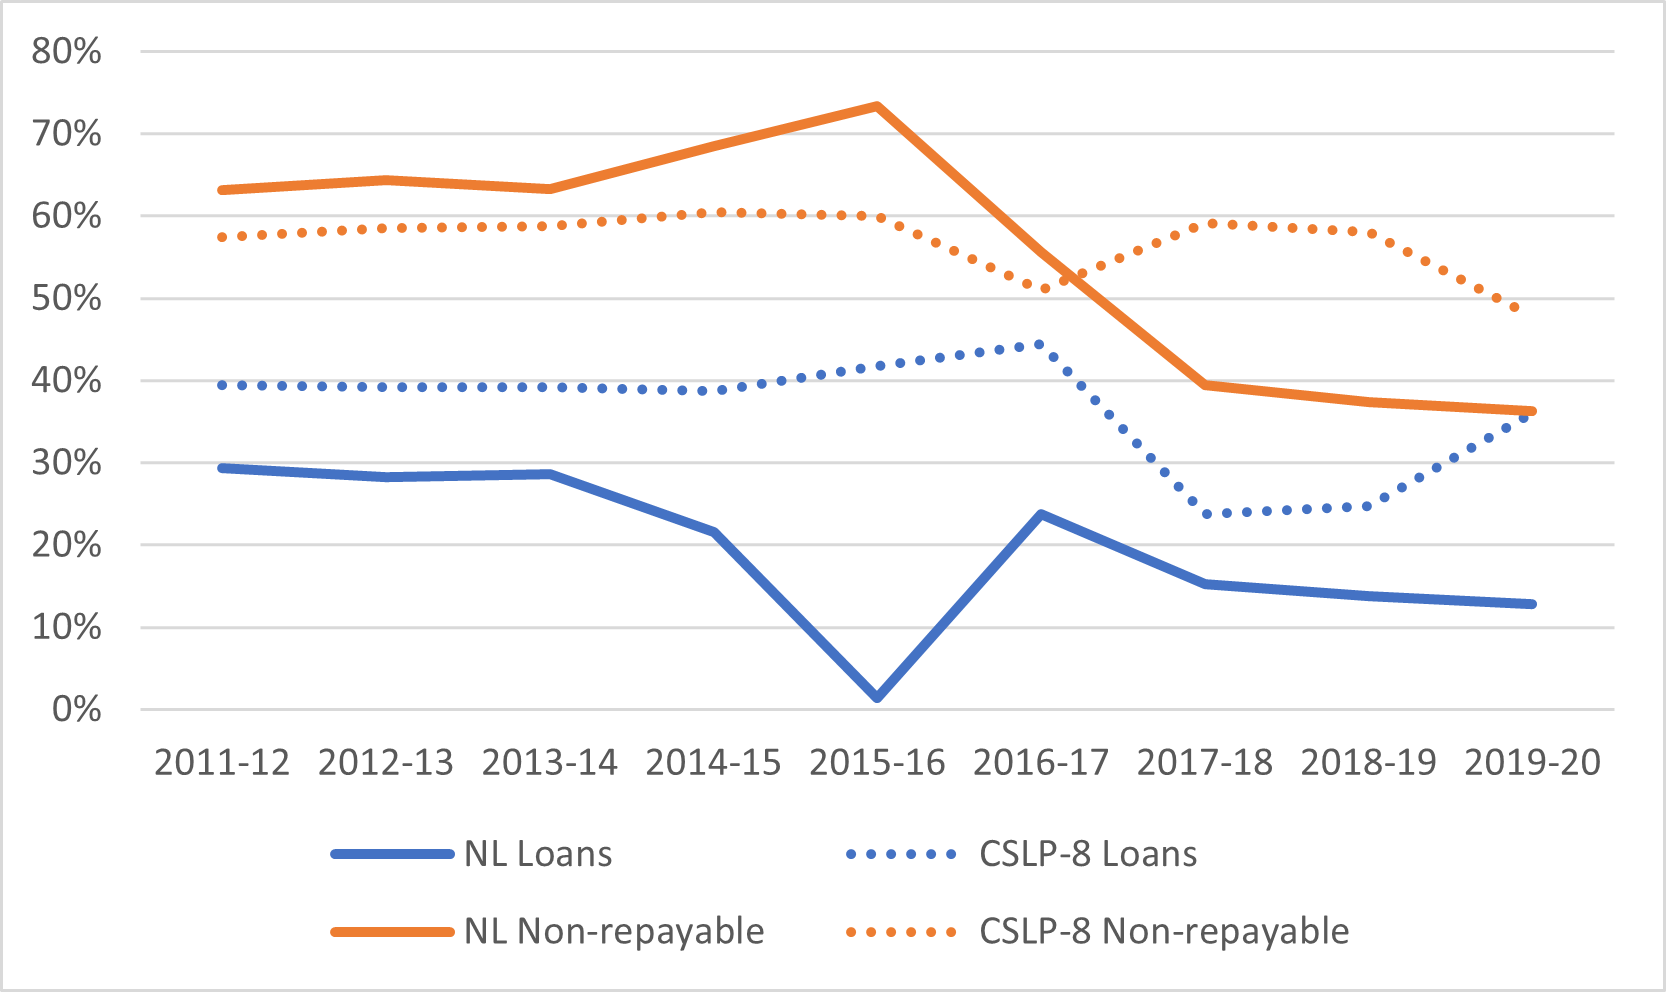
Finally, Figure 9 looks at how much of the province’s student assistance comes from provincial as opposed to federal sources. For this exercise, I compare Newfoundland and Labrador to the other eight provinces which participate in the Canada Student Loans Program, (i.e.. excluding Quebec). What we see in this figure is that where both loans and grants are concerned, Newfoundland and Labrador contribute less to the total aid package than other CSLP provinces. With loans, the province only provides 19% of all loans issued in the province (vs 36% in other CSLP provinces), and with respect to non-repayable aid it provides just 36% of all funds (compared to 48% in other CSLP provinces). It would therefore not be entirely unfair to say that Newfoundland’s reputation as a low-cost province has depended for some years now on the federal government’s willingness to carry an oversize portion of the cost on student aid.
Figure 9: Provincially-Funded Loans and Grants Disbursed as a Percentage of Total Loans and Grants Disbursed, NL vs. 8 other Canada Student Loans Program Provinces, 2011-12
 Tweet this post
