

Every couple of years, the Canadian Federation of Students (CFS) produces a “research paper” to provide a new “evidence-based” spin to back up its eternal demand for free tuition. Last month, they put out a new version, this one entitled The Political Economy of Student Debt in Canada. The theme this time is lightly-recycled Piketty: Canada’s main problems are inequality and rising indebtedness; if we eliminate tuition, that’ll strike a blow against both so wa-hey! The word “neoliberal” appears frequently.
This is all fine. It’s Lobbying 101 to link your own issues to those of the ruling government’s agenda in order to increase the likelihood that they’ll get picked up. Inequality is certainly a theme of this decade, as is the constant media drumbeat of ever-rising household debt (though for reasons that pass understanding they never match up statistics about rising debt with equivalent statistics about rising assets).
But there is a problem here. To make the analogy stick you’d have to be able to prove that student debt, like household debt, is rising rapidly when in fact it’s not. Data from the National Graduates Survey (NGS) suggest that student indebtedness has been more or less stable since 2000; the more recent/timely (but less accurate) Canadian Undergraduate Survey Consortium data (see here and here) actually suggests it has decreased a bit since 2000. And it is certainly the case that student loan burdens – that is, the percentage of after-tax income devoted to paying student debt – has decreased substantially over the last decade and a half, due mainly to falling taxes and lower interest rates. Average student loan debt – that is, the amount of debt owed by students at the time of graduation – may in fact perhaps the one type of personal debt which isn’t increasing.
So imagine my surprise when I saw this graph in the middle of the research paper, purporting to show that student debt has increase 40% in real terms since 1999:
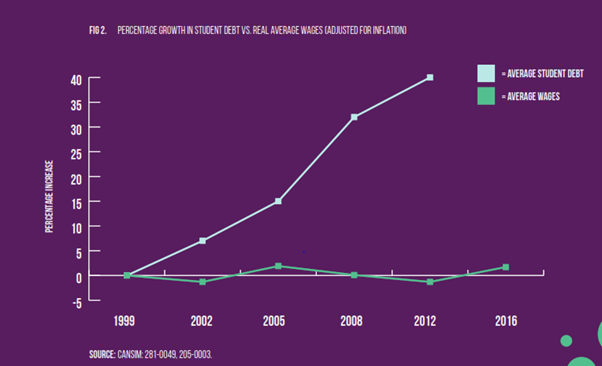
Where on earth does this data come from? Well, it’s not the NGS and it’s not any survey of graduating students. Rather, it’s from the once-triennial, now quadrennial Survey of Financial Security (SFS), which measures student debt in an entirely different way.
Both NGS and the CUSC try to measure the average debt at the point of graduation. NGS does it by asking graduates two years after graduation how much debt they left school with; CUSC asks students a couple of months before they graduate how much debt they have. SFS is not a survey of graduates; it’s a survey of 20,000 or so Canadian households. And when it reports debt, it does so i) by measuring outstanding debt, not debt at the time of graduation and ii) be measuring household debt, not individual debt. So if your household contains multiple individuals with student debt (whether as roommates or in a family relationship), SFS will combine the debt of all individuals. The second factor will definitely tend to inflate the amount of debt reported; the first is more ambiguous because on the one hand it is including both borrowers who graduated recently and those who graduated many years ago (which one would think would lower the average figure because the latter have been in repayment for many years), but on the other will tend to exclude those who graduated with lower debt because they will often have paid it off and hence be excluded from the statistic (thus raising average debt somewhat).
Also, because it measures outstanding debt rather than debt at graduation, it will tend to lag trends in student aid. That is, even after student debt at graduation stops rising, outstanding student debt will continue to rise as earlier cohort of (less indebted) graduates repay their loans and later cohorts of (more indebted) graduates take their place in the ranks of “those with outstanding student debt”. So it’s not really a big surprise that outstanding household student debt rose in the 2000s, because that’s the natural corollary of rising student debt at graduation in the 1990s (which, unlike rising student debt in the 2000s was actually a thing).
The point here is not that the data used is “fake”: the data itself is real. But to make their point about “rising student debt” the CFS’ report writers have used a quite different definition of student debt than that used by literally every other PSE stakeholder, indeed different to any definition of student debt CFS has ever used. And they have done so without mentioning that they have used an alternative definition. This is not an innocent oversight. The person or persons who authored this document clearly know their way around Statistics Canada data; anyone with that level of knowledge also understands that if you say “student debt has risen 40% since 1999”, people will understand that to mean “individual debt at graduation”, not “outstanding household debt amongst the entire population”. It’s a deliberate deception to further a politically convenient narrative.
Student debt, as that term is commonly understood, has not risen by 40% in real dollars since 1999. On the contrary, student debt levels are broadly stable and repayment burdens are much reduced over the past decade and a half. Using torqued, cherry-picked statistics to try to convince the public that the reverse is happening is pretty poor form.
 Tweet this post

It is hard enough to get support for good data and the use of data to inform policy decisions (remember the long form census). Stuff like this really sets us back, and it hurts even more because it is coming from students.
Interesting post. My only comment pertains to a side point that is made:
|(though for reasons that pass understanding they never match up statistics about rising debt with equivalent statistics about rising assets).”
I agree that including details about assets is important. If debt is being accrued due to consumers purchasing durable goods this is fundamentally a different matter than going into debt to eat at restaurants or going on ski trips.
However the value of debt and the value of assets should not be taken as equivalents more generally given that assets and their values need to be realized through sale in the marketplace whereas debt is already realized. If I go into debt $1000 to buy a television the book value of the television may be $1000 however I would be hard pressed to realize that value by placing the television back into circulation. This is compounded at the aggregate given that if everyone all at once decided to realize the value of their assets the collective price(s) would decrease given the sudden jump in supply in the market.
Perhaps there is a way in economics that I am unfamiliar with that takes this into account?
Thanks