


I was poking around some data from the Canadian Undergraduate Survey Consortium the other day and I found some utterly mind-blowing data. Take a look at these statistics on the percentage of first-year students self-identifying as a “visible minority” on the Consortium’s triennial Survey of First Year Students:
Figure 1: Self-Identified Visible Minority Students as a Percentage of Entering Class, 2001-2013
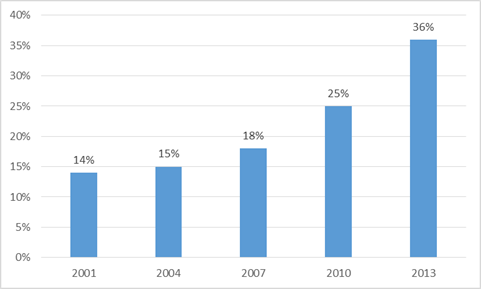
Crazy, right? Must be all those international students flooding in.
Er, no. Well, there are more students with permanent residences outside Canada, but they aren’t necessarily affecting these numbers, because they represent only about 7% of survey respondents. If we assume that 80% of these students are themselves visible minorities, and we pull them out of the data, the visible minority numbers look like this:
Figure 2: Visible Minority Students, International* vs. Domestic, 2001-2013
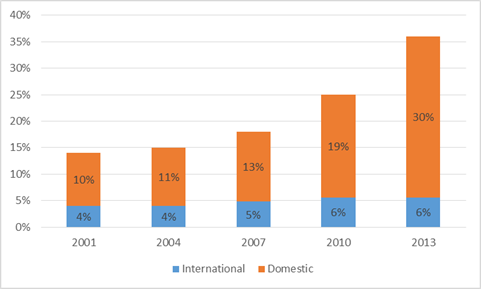
*assumes 80% of students with permanent residences outside Canada are “visible minorities”
That’s still a heck of a jump. Maybe it has something to do with the changing demographics of Canadian youth?
Well, we can sort of track this by looking at census data on visible minorities, aged 15-24, from 2001 and 2006, and (yes, yes, I know) the 2011 National Household Survey, and then marry these up with the 2001, 2007, and 2013 CUSC data. Not perfect, but it gives you a sense of contrasting trends. Here’s what we find.
Figure 3: Domestic Visible Minority Students as a Percentage of Total vs. Visible Minorities as a Percentage of all 15-24 Year-Olds, 2001, 2007, 2013
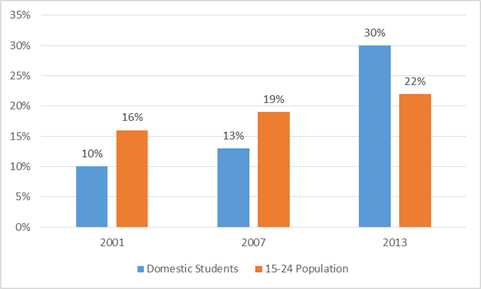
So, yes, a greater proportion of domestic youth self-identify as visible minorities, but that doesn’t come close to explaining what seems to be going on here.
What about changes in the survey population? Well, it’s true that the consortium metric isn’t stable, and that there is some movement in institutions over time. If we just look at 2007 and 2014 – a period during which the number of visible minority students almost doubled – we can see how a change in participating schools might have shifted things.
Table 1: Schools Participating in CUSC First-Year Survey, 2007 and 2013
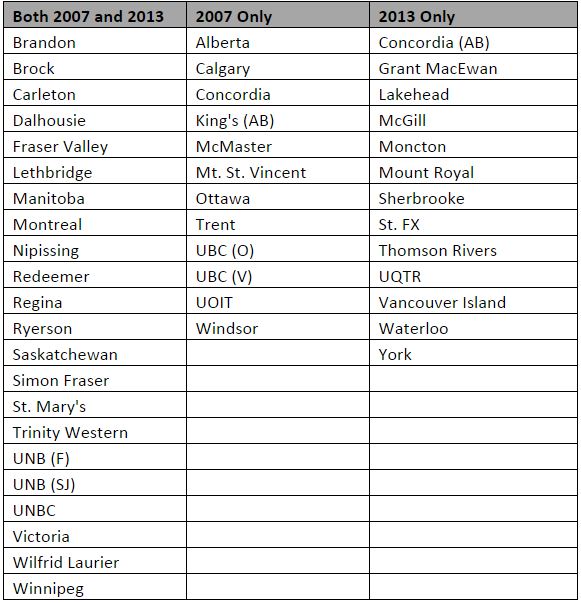
Here’s what stands out to me on that list. York and Waterloo are in the 2013 survey, but were not there in 2007, which you’d think would skew the 2013 data a bit higher on visible minorities (although not that much – together, these two schools were only 7% of total sample). On the other hand, UBC Vancouver was there in the 2007 survey, but not 2013, which you’d think would skew things the other way. On the basis of this, I’d say a school participation probably contributed somewhat to the change, but was not decisive.
I could end this post with a call for better data (always a good thing). But if a trend is big enough, even bad data can pick it up. I think that might be what we’re seeing here with the increase in visible minority students. It’s a big, intriguing story.


4 Responses
That seems consistent with a lot of the statistics about 2nd generation immigrants to Canada; they are a group with some of the highest attainment rates in University. (http://www.statcan.gc.ca/pub/81-004-x/2011004/article/11595-eng.htm) Couple together a higher number of children of immigrants from non-european waves of immigration with significantly higher participation rates, and you’d get precisely that kind of jump.
Wonder what the outcome is if you look only at the schools that participated both years.
Good question. Data not available.
This is interesting, as is your more recent analysis of the 2016 visible minority data. What would also be as interesting is to see is the gender break-down for visible minority male and female respondents both for domestic and international students. I am curious what variation, if any, exists between the two groups.
As an aside, this data analysis is important for universities that link their diversity strategies to internationalization (as if diversity is external to Canada) rather than (or also) to the always existing and rapidly growing diversity of domestic students (as Canadian cities and the country itself).