

[the_ad id=”11819″]
In December, Statistics Canada released its 2015/2016 enrolment data from the Post-Secondary Student Information System. I didn’t quite have time to get to it before the break, but on New Year’s Day I decided to take a little stroll through the data. Here’s what I found:.
The first obvious thing to note is that growth in student numbers is a thing of the past. For the second straight year, total enrolment in Canadian post-secondary is down slightly, which is the first time that’s happened since the mid-1990s.
Figure 1: Total enrolments by Institution Type, Canada, 2006-07 to 2015-16
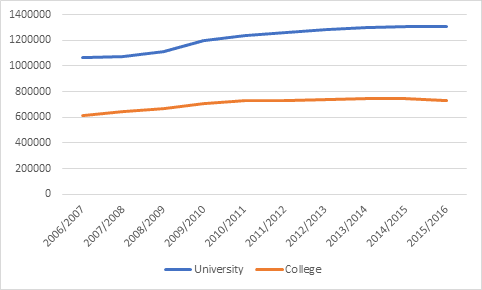
Post-secondary numbers are still up substantially from a decade ago but still mostly the same as they have been for roughly five years now. Last year, university numbers rose by the tiniest increment, from 1.305 million to 1.307 million. College numbers fell by almost 3% from 750,000 to 728,000, but most of this drop occurred in Ontario, where numbers were reported on a slightly different basis in 2015-2016 than in previous years (it is now reported centrally by the Ministry rather than individually by each college), so it’s possible that this is a the result of a methodology change and not an actual change in situation.
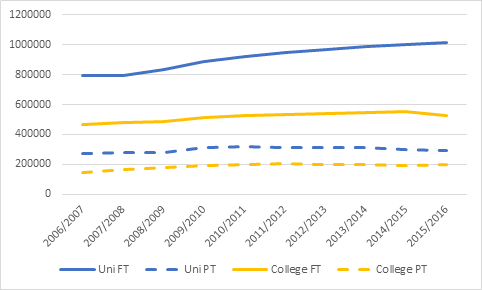
Figure 2 breaks the data out by student status, where the trends differ slightly across universities and colleges. In universities, the full-time to part-time ratio is rising while in colleges it is staying stable. But even here, if you look at the longer term, the larger picture is essentially one of very slow gradual change.
Figure 2: Total enrolments by Institution Type and Student Status, Canada, 2006-07 to 2015-16
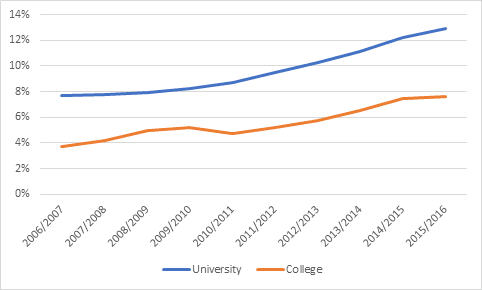
Of course, both the foregoing figures include both Canadian and international students. As figure three shows, the percentage of international students is on the rise in both Canadian colleges and universities. In the university sector, roughly two thirds of all student growth since 2009/10 has been from international students; in the college sector the situation is a bit less certain because of data processing issues in Ontario but it would not appear to be lower than fifty percent. In fact, if international students are excluded and we look simply at domestic students, universities and colleges are both shrinking slightly.
Figure 3: International enrolments as a percentage of total enrolments, Canada, 2006-07 to 2015-16
In terms of regional distribution, pretty much every province has seen increases in enrolments in both colleges and universities over the past decade (exceptions: universities in New Brunswick and colleges in BC and Alberta). It is perhaps a little more interesting to see things on a shorter time-frame, perhaps since enrolments really began flattening out in 2009-2010. Since that time, universities have grown by only 9%, and nearly all of that (93%) has occurred in Ontario, Quebec and British Columbia. College growth is a bit more widely spread (and Manitoba’s outlandish 44% growth is mostly due to a change in reporting on vocational students).
Figure 4: Total enrolments by Institution Type and Province, Canada, 2009-10 to 2015-16
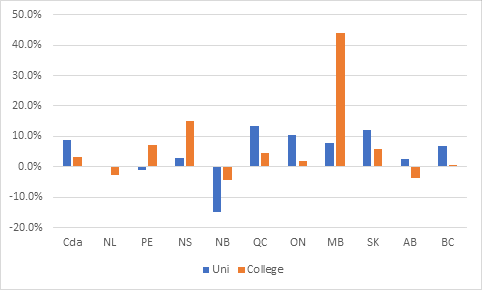
Maybe the most interesting thing about figure 4 is what is happening in Alberta and British Columbia. For the most part, enrolment trends line up with changes in youth populations: larger in places like Ontario and Quebec, where youth population reductions have been muted, smaller in Atlantic provinces where the decline has been more pronounced and an absolute dumpster fire in New Brunswick. But if enrolment trends were related to demographics, one would expect much larger increases in Alberta and British Columbia than elsewhere. Yet the reverse seems to be the case, which suggests that there may be some access issues to contend with in these provinces (my guess: weak grant programs and inadequate space provision).
So the big picture here is mostly “steady as she goes”: no big changes, just a continuation of trends that have been evident for a few years now. That is, except for the data on changes in enrolment by field of study which is pretty mindblowing. But more on that tomorrow.
 Tweet this post

Hi Alex
Final figure I believe needs a new title (% change not total) & description needs some changes (doesn’t exactly match data).
Otherwise, great work! Appreciate your reports.
Julia
In regards to Figure 4 and changes to student populations by institution type some of the changes may be driven at a higher level. For example in the time period reported (2009-10 to 2015-16) Alberta has seen a variety of public and private institutions transition from college / university college to university (e.g. MacEwan University, Mount Royal University, The King’s University, etc). I wonder if this is reflected in the change in student numbers in Fig. 4.