

The OECD put out its annual Education at a Glance publication yesterday. No huge surprises except for the fact that they appear to have killed one of the most-used tables in the whole book (A.1.2, which compared tertiary attainment rates for 25-34 year olds by type of tertiary program – i.e. college v. university) which is an enormous bummer. The finance data says what it pretty much always says: Canada is the #2 spender overall on higher education at 2.6% of GDP (just behind the US at 2.7%). If you read my analysis last year, the story is still pretty much the same this year.
But there are some interesting nuggets buried away in the report nevertheless – stuff that other media won’t pick up. I thought I would highlight two of them in particular which pose some thorny questions about Canadian statistical data and what we think we know about higher education.
Let’s start with the data on expenditures per pupil at the tertiary level. Figure 1 looks at costs in Short-cycle Tertiary Education (meaning career-oriented, which in Canada’s case means community colleges)
Figure 1: Total Expenditures per Student, Colleges (or equivalent), Select OECD countries

Among major countries, Canada spends the most (from both public and private sources) on college or college-equivalent student. A couple of countries actually do outspend us (the Austrians and – totally out left field – the Czechs), but the important point here is that our expenditures are nearly 40% above the OECD average. And if you’re wondering why the UK and the US aren’t there, it’s because the former has no college equivalent and the latter chooses to not to report on colleges on the batshit crazy spurious grounds that even if you’re studying for a (college-equivalent) associate’s degree, the fact that this can be laddered up into a full bachelor’s means everything is really degree-level. Nonsense, I know, but there we are.
Now, let’s do the same with universities:
Figure 2: Total Expenditures per Student, Universities, Select OECD countries
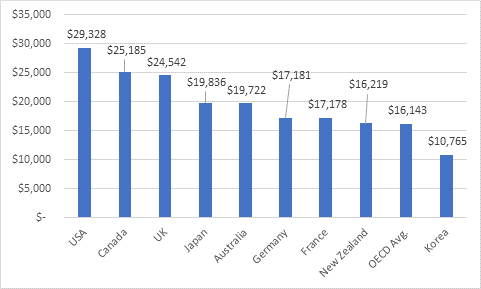
There’s not much in figure 2 we didn’t already know: US and Canada in terms of total expenditure per university student at the top with us over 50% above the OECD average and Korea way down at the bottom because the Koreans do everything in higher ed on a shoestring.
Now, one new little detail that OECD has added to Education at a Glance this year is that it splits out the portion of total expenditures (that is combine short-cycle and degree-levels) which are devoted to R&D. And this data is a little odd.
Figure 3: Total R&D Expenditures per Tertiary Student, Selected OECD Countries

There’s nothing obviously egregiously wrong with figure 3 – except for the data on the USA, which is bananas. Read literally, it suggests that Canadian universities on average spend twice as much on R&D as American ones do and that’s simply false.
(The explanation, I think, is that Canada and possibly some other countries claim that all professors’ time spent on research – notionally 40% of time or thereabout – counts as “R&D”. Whereas Americans claim that their universities – which only pay staff for 9 months a year with the rest of the time notionally off for research – do not count time that way, preferring to claim that the government is buying profs’ time with research grants. Basically, they view universities as mailboxes for cheques to pay for staff time and so all that time money gets claimed as government expenditure on R&D, not university expenditure on R&D. GERD, not HERD, in the innovation policy lingo. I think, anyway).
What’s actually a little crazy about figure 3 is that the denominator is all tertiary students, not just degree-level students. And yet we know that R&D money is pretty heavily concentrated (98%+) in universities. In a country like Germany where over 99% of tertiary students are in degree-level institutions, that’s not a big deal. But in Canada, about a third of our students are in short-cycle programs. Which means, if you do the math, that in fact the R&D expenditures per university student are a little ways north of $9750. Now here’s figure 3 again, with just degree-level students in the denominator.
Figure 4: Total R&D Expenditures per University Student, Selected OECD Countries

And of course, subtracting these numbers means we can revisit figure 2 and work out total non-R&D expenditures per student in universities. Canada still remains 40% or so ahead of the OECD average, but is now similarly that far behind the US in per-student expenditure.
Figure 5: Total non-R&D Expenditures per University Student, Selected OECD Countries

Now, to be clear: I’m not saying OECD is wrong, or Statscan is wrong or anything else like that. What I’m saying is that there appear to be major inconsistencies in the way institutions report data for international comparative purposes on key concepts like R&D. And that this particular inconsistency means that Canada at least (possibly others) look a lot better vis-à-vis the United States than it probably should.
Just something to keep in mind when making comparisons in future – particularly around research expenditures and performance.
 Tweet this post
