

Morning all. Our annual State of Postsecondary Education in Canada piece is now available on our website. It updates the data from last year, plus adds a little bit of extra contextual data on the student body and international comparisons. But more than anything else, it shines a light on one key theme: the changing finances of Canadian universities and colleges; and the consequence of the prolonged freeze in government transfers to institutions.
Back in 2010-11, provincial governments were collectively handing over $22 billion per year (in real $2016) to institutions. This figure has since fallen by about 5% to now sit at $21 billion. This decline occurred despite an increase in enrollments; when measured on a per-student basis, the decline in provincial funding is to the order of 15%. For the most part this erosion has been quiet – a freeze in nominal contributions here, a cutting back on new construction projects there – but it is no less real for all that.
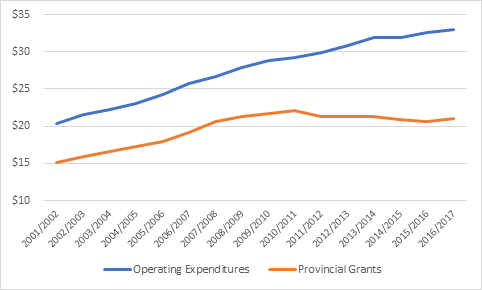
This slowdown in government funding did not result in a diminution of the activity at Canadian universities and colleges. Over the past decade, Canadian institutions have accomplished some important things. Enrolment grew by 21%. Research output – both basic and applied – increased substantially. Institutions coped with much higher IT costs computing became increasingly ubiquitous, increased demand for student services, and – especially – much higher costs related to an increase in the proportion of students enrolling in expensive STEM programs. And all this cost money: on average, operating expenditures continued to expand by about 2% per year on top of inflation. Consequently, as figure 1 shows, the gap between provincial grants and operating expenditures has grown from $6 billion to $12 billion.
Figure 1: Operating Expenditures v. Provincial Grants in billions, 2001-02 to 2016-17
Absolutely no prizes for working out where all that extra money is coming from: nearly all of it is coming from students. Between 2007-08 and 2016-17, income from students jumped by 69% in real terms from $8.1 billion to $13.7 billion. Some of it is from domestic students, though not from tuition hikes, which have been fairly modest; instead, it has come from admitting more students and students switching into more expensive fields of study like Engineering. But the majority of it – 58% or so – comes from a different source: international students.
Figure 2: Growth in International and domestic tuition fee revenue, 2007-08 to 2016-2017 (in billions of $2016)
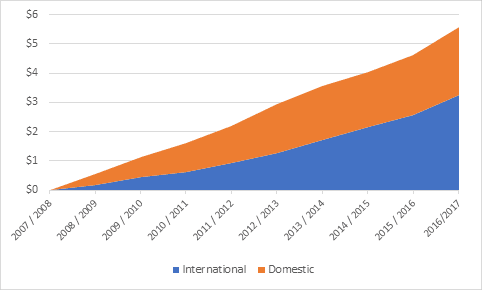
This wasn’t just a matter of increasing international student numbers. True, those are up 123% over 2007-08 levels, but over the same period, international student fee revenue rose by an eye-popping 218%, leaving institutions roughly $3.25 billion richer than they had been nine years earlier (domestic fee revenue rose by a more modest $2.34 billion or 35%). The fact is, average tuition for international students is increasing at 5% per year in real terms, compared to just 1.5-2% per year for domestic students.
This massive influx of cash has produced is slowly but surely changing the nature of the Canadian PSE system. In 2016-17, for the first time in over 60 years, the proportion of university and college funds coming from public sources fell below 50%. Our system, properly-speaking, should no longer be considered “publicly-funded”, but rather “public-aided”. Canadian schools are embarking on the trail previously blazed by the UK and Australia, where universities are heavily dependent on international students and – this is probably not a coincidence – find it difficult to weld together a strong public consensus in favour of greater funding.
Maybe that’s where we want to be. It’s not as though either the UK or Australia have terrible tertiary education systems (though our college system is miles better than either). And it’s difficult in many ways to argue with the attractions of getting foreigners to subsidize your own educational system. But the question is: what’s the cost? Can universities effectively meet their missions to their local community if they are focussed on meeting the demands of a global one? The evidence from Australia and the UK would suggest there are reasons to doubt this.
There is no magic solution here. There are only two alternatives to the current path: either governments start spending a lot more money, or post-secondary institutions put a halt to their spending growth. For a host of reasons, neither of those paths seems as likely as the current one – a slow sleepwalk down the same path Australia took a decade ago. I’m not convinced we’ll like it when we get there; but neither do I think that Canadian public policy, where mindless drift is the rule rather than the exception, is up to the challenge of getting us anywhere else.
 Tweet this post

Great to have another, updated version of the State of Postsecondary Education in Canada! Kudos to Alex and the other authors!
It is not trying to diminish this accomplishment by saying that you got the German electrician apprenticeship figures incorrect: When this category is broken down into the 21 sub–categories (as the German Federal Institute for Vocational Training does in its annual report ) and numbers counted, there is a total of roughly 105,000 young people in electrician-related apprenticeships (data from 2016). Most of them require three years of training in the dual mode, a few just two years, and some 3 1/2 years.
This shows that apprenticeships in the electric and electronic trades have become much more sophisticated and most of the graduates would be called in Canada ‘technicians’ rather that ‘journeymen’ as in the past.
A vast and complex field – too complex for simple quantitative comparisons as you suggest.
Hi Hans. Thank you for the correction. i was working from a Statistisches Bundesamt document which is probably not as detailed as it could have have been. Could you direct me to the Vocational Training Institute Document? Always looking for better data!
A
Thank you for the comprehensive information. I always find data regarding our higher education system in Canada fascinating. I just wanted to point out a few issues regarding the publication. Forgive me if I’m missing something but I wasn’t able to locate Figure 1.14 which is referenced on page 24 (and doesn’t seem to be listed in the List of Figures). Also some of the page references listed in the List of Figures seem to be off (Figure 1.4 is listed as being on page 14 but is actually on page 16).