


Yesterday, we looked at the history of post-secondary education in Alberta; today, I want to look more at some of the data on finances and student numbers, just to give you all a better sense of how the province compares to the rest of Canada.
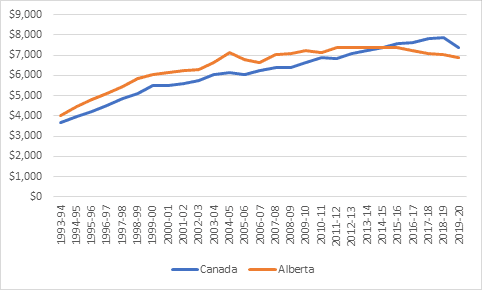
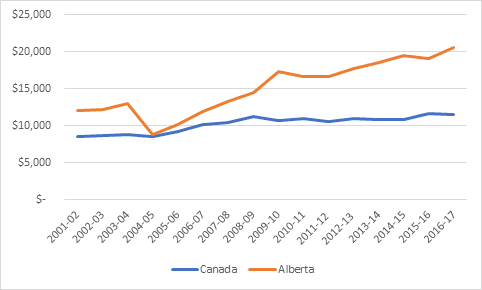
Let’s start with tuition fees. For the last quarter-century or so, Alberta has stayed pretty close to the Canadian average. Until 2013-14 it was above the average; since then, it has been below. But the gap was never that big either way.
Figure 1: Average Undergraduate Tuition fees in constant 2019 dollars, Alberta vs. Canada, 1993-94 to 2019-2020
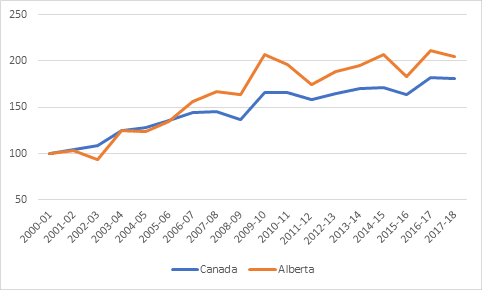
Now, let’s turn to institutional finances. It is sometimes said that Alberta institutions are significantly richer than their counterparts in the rest of Canada, and that’s true to an extent. Figure 2 compares changes in total university income in Alberta and in Canada since 2000-01. What it shows is that Alberta university funding increased at roughly the same rate as the rest of Canada in the periods 2000-2004 and 2010-2018. But in between, there was a pretty hefty one-time jump that lifted Alberta spending to a (hitherto) permanently higher plateau.
Figure 2: Change in Total University Income, in constant dollars, Alberta vs, Canada, 2000-01 to 2017-18
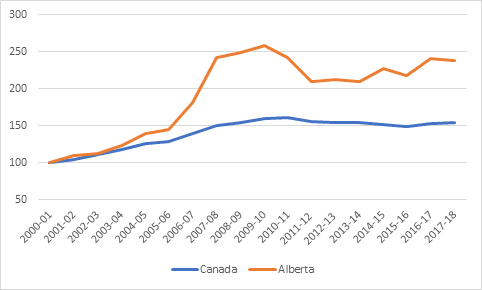
So caused this change? In a word, it was public funding from a provincial government that was temporarily crazed with supercharged revenues when the price of natural gas was hovering around $9 instead of the current $2.50. Figure 3 shows the change in universities’ income from provincial governments for Alberta and Canada since 2000-01. In this graph, the 2000 level of revenues = 100, so the way to read this is that in Canada, real income from provinces rose 50% over the last two decades, while in Alberta it rose nearly 150%.
Figure 3: Change in University Income from Provincial Governments, in constant dollars, Alberta vs, Canada, 2000-01 to 2017-18
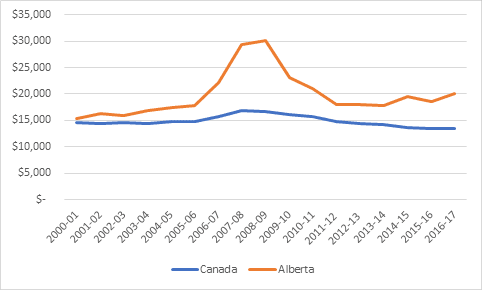
Of course, this isn’t quite a fair comparison over time because in the late 2000s, Mount Royal and MacEwan both switched over from college status to university status and that does inflate the numbers a little bit. Perhaps a fairer comparison would be just to look at provincial government expenditures per full-time-equivalent (FTE) student over the period, which is shown below in figure 4. We still see a huge run-up in funding in the late 2000s, but one which falls back again after 2009. This is mostly capital expenditures, from that brief period of astounding generosity where the provincial government just decided that the University of Alberta (in particular) should be the biggest building site this side of Beijing. It didn’t entirely last. But whereas the Alberta government’s per-student expenditures were 5% above the national average in 2000, they were 48% above the national average in 2017-18.
Figure 4: Universities’ Per-FTE-Student Income from Provincial Governments, in constant dollars, Alberta vs, Canada, 2000-01 to 2016-17
Ok, so what about colleges? Getting per-student data for colleges over this period is a mess for a couple of reasons. First, Statscan’s method of a once-per-year snapshot method of counting students is less well-suited to colleges (which are more likely to operate on a continuous intake basis) than universities – its FTE counts therefore tend to be lower than the kinds of full-load equivalencies that colleges themselves and provincial governments tend to use. Second of all, Statscan’s historical data on college students is pretty iffy because for a long time it just did not capture vocational students. In Alberta, about 20,000 of these previously un-counted students just popped into its count in 2004, which thereby lowered per-student expenditures considerably. But since that time, as figure 5 shows, it’s fairly clear that per-student expenditures in colleges have been rising at a pretty steady rate.
Figure 5: Universities’ Per-FTE-Student Income from Provincial Governments, in constant dollars, Alberta vs, Canada, 2000-01 to 2016-17
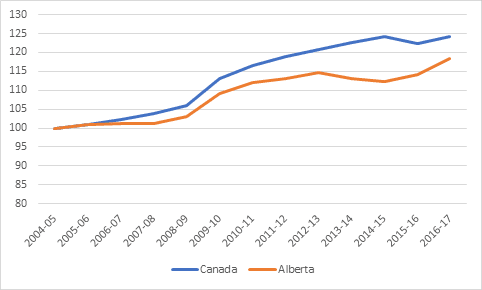
Well, hang on, you say. Mightn’t the problem have more to do with stagnant or declining student numbers rather than larger real increases in funding? Well, no, not really. As figure 6 shows, if you look at the period from 2004 onwards (that is, after the point where all those vocational students suddenly get included), it is true that growth in Alberta FTE numbers have been trailing those in the rest of the country slightly, but not enough to change the overall picture.
Figure 6: Change in FTE PSE enrolments, Canada v. Alberta, 2004-05 to 2016-17
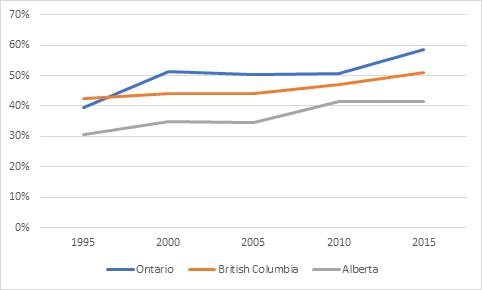
That said, what is true is that young people in Alberta are substantially less likely to attend post-secondary education than youth in other provinces. Figure 7, adapted from a HEQCO report I wrote about three weeks ago, shows the participation rate (in any type of PSE) of 19 year-olds in Ontario, Alberta and British Columbia using census or National Household Survey data going back to 1995.
Figure 7: PSE Participation rates of 19 year-olds, selected provinces, 1995-2015
Overall, what you can say about Alberta is the following: it is a relatively rich system, primarily because the Conservative government of Ed Stelmach decided higher education was a good way to invest the hydrocarbon windfall and no subsequent government (until now) chose to reverse the policy. Both the university and college sectors have benefited from this largesse. Despite all this extra money, participation rates still lag the rest of the country; one consequence of this is that on a per student basis Alberta looks especially generous.
But what Alberta has bought with that money is not negligible. It has maybe the country’s best resourced college system, and certainly two of the most impressive technical institutes. It has two universities in the world top-200, something very few jurisdictions of its size can say (on a per-capita basis, only Massachusetts, Switzerland and the Netherlands can top it.) Cuts on a scale sufficient to make Alberta look like “the rest of Canada” put all of this at risk, and do nothing to help alleviate the key problem of low participation rates, either. It’s going to be a tricky few years.


7 Responses
I’d be interested to see what Alberta’s PSE participation rates are in the past few years post oil price crash. I lived in Prince George, BC, in the 1990s. It was quite common for kids to go straight to work in the mills/forestry sector right out of high school and earn big bucks. When the softwood lumber crash hit, and many lost their jobs, expensive trucks, and other toys, we started seeing them enroll in PSE.
Full-load enrollments across PSE sector in 2017-18 were up about 5% over 2013-14. Mostly in colleges and institutes.
https://open.alberta.ca/dataset/ffcaf092-af60-4149-aeec-005c8476e321/resource/325ac332-815e-458f-a1ee-e2ad50c0cee2/download/five-year-fle-enrolment-summary-table.pdf
A
Thanks for this.
Excellent articles – thanks. I wonder if the higher post secondary funding per student (and higher costs overall) would have something to do with the build-out and support of that broad college network – particularly outside of the major cities. I suspect the social benefits of having so many rural colleges justifies what must be a higher per student operating costs. I wonder if the geographic (and critical mass) consideration would explain the cost per student difference on a national scale. Any sense as to the average student per institution comparison? I think we might have too many institutions and would financially benefit from some consolidation at the college level. Thoughts?
“But what Alberta has bought with that money is not negligible.”
From what you say, it would seem they only rented all these things, since they have to keep paying.
I’m interested in the use of ‘participation rates’ as a measure of success. What is, in your view, or the Governments’ view, the ‘ideal’ participation rate? We constantly see it cited as something that needs to be addressed in Alberta, but also in Canada relative to other countries. One gets the impression that, in the eyes of many, ‘higher participation = better’, with no end in sight. I’m not convinced that this true. At the very least some critical discussion around this seems warranted, as there are real costs, in addition to benefits, from encouraging/forcing/paying for more people to go to post-secondary.
To contribute to the discussion, I personally don’t see participation rate on its own as being very instructive. Context is always so important for any stat. Different communities have such different circumstances, it is even difficult to compare communities within Canada (Alberta vs. Ontario vs. NS), let alone much larger countries like the US (Texas vs. California vs. Maine).
Places like Alberta for a long time had a lot of oil money. Students, even very bright ones, can and did often make the choice not to participate in PSE because there were jobs that paid near $100,000 without an education requirement. It was not a situation where the educational system failed the population. The economy simply provided viable and rational alternatives that were quite attractive. The boom is no longer here so things have changed. So if we see an increase in PSE participation post-boom, are we going to say the government is doing a better job? Or will we attribute it to the elimination of that viable alternative that previously played such an important role?
There was a time when Alberta’s high school education was near the top of the world, certainly at the top in Canada (losing only to Quebec in math, and dominating in all other fields). Back then, if you separated Alberta from Canada, Alberta was literally #2 in the world after Finland. Despite this, it wasn’t unusual, given that it was the boom years, to see students drop out of school to join the oil industry. It wasn’t necessarily a failure in the educational system, it was partially a situation where rational actors had incentive to not choose PSE based on economic efficiencies. Alberta has since dropped in High School education competitive ranking, but the point remains. The picture was and is complex.