

One often hears university administrators say things like: “if we don’t reduce growth in salary mass, we’re all in trouble”. Sometimes, the word “academic” gets thrown in front of salaries, for good measure. In response, one often hears faculty unions say: “but academic salaries are down as a proportion of operating spending since 1992”, or “salaries as a proportion of the budget have remained constant in recent years”, and conclude from this that salaries can’t possibly be the problem.
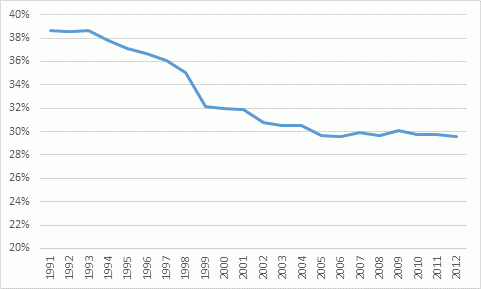
How should we evaluate these claims? Well, first off, we should acknowledge that these are all true statements. Let’s start with the question of academic salaries as a proportion of operating budgets. Between 1990 and 2002, these did fall substantially, from about 39% of total operating expenditure to about 30%. But it has remained more or less constant thereafter. There were multiple reasons for this fall, the main one being that academic staff numbers actually fell during the mid-90s under the effects of that decade’s austerity, which meant that absolute dollars spent on staff were frozen from about 1992 to 1999.
Figure 1: Academic Salaries as a Percentage of Total Operating Expenditures, 1991-2012
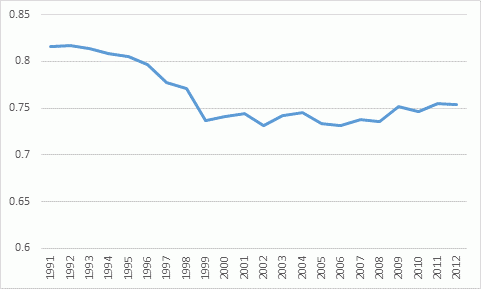
Of course, one countervailing factor here is that a greater proportion of compensation is now going out in the form of benefits (mainly pensions) rather than salaries. So sometimes, instead of looking just at academic salaries, we want to look at total compensation – and not just for academics, but for all employees. Figure 2 shows all compensation as a percentage of operating budgets. This, too fell in the 90s, but is just now starting to edge up a bit again, to around 75% of total spending.
Figure 2: Total Spending on Compensation as a Percentage of Operating Budgets, 1991-2012
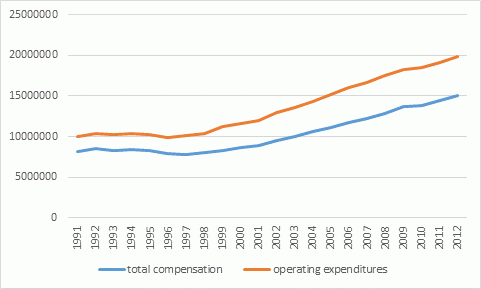
Now, looking at these graphs, you could very well ask: “so what’s the problem?” As indeed many faculty unions do. Well, the answer is that these graphs represent fractions: expenditures as a percentage of total expenditures. But it’s worth looking at both the numerator and the denominator here. Figure 3 shows what has been happening to total operating expenditures in Canada. Between 1998 and 2012, expenditures increased by 67% after inflation, or an average of 4.7% per annum in real dollars.
Figure 3: Total Operating Expenditures and Expenditures on Compensation, in $2012, 1991-2012
So it’s quite possible to look at Figure 2 and say, “up to 2012, staff compensation was in no way a cause of financial hardship to universities”. However, to go from here, to saying: “therefore we don’t need to worry about compensation, and things can continue on as before”, requires one to believe that university revenues will continue growing at 4.7% per year, in real dollars. And flat out, that hasn’t been happening, and isn’t going to happen anytime soon.
Take a look at the last couple rounds of provincial budgets. On average, the 2013-14 budgets saw funding go down by 0.7%. The 2014-15 round saw them increase by about $7 million nationally (or 0.066%). And that’s in nominal terms – in real terms, that’s a decrease of about 4%. Now, tuition increases of 6.6% over two years makes up for that a bit, but at best – even including the effects of rising international student numbers – we’re probably looking at increases in operating budgets of about 1.5% in the last two years, and in all likelihood for the foreseeable future ( and this year will almost certainly be less than that).
So, assuming 4% increases in compensation costs, and 1.5% increases in income, what does Figure 2 look like, extended out a couple of years? Figure 4 tells the tale.
Figure 4: Total Spending on Compensation as a Percentage of Operating Budgets, 1991-2017 (Projected)
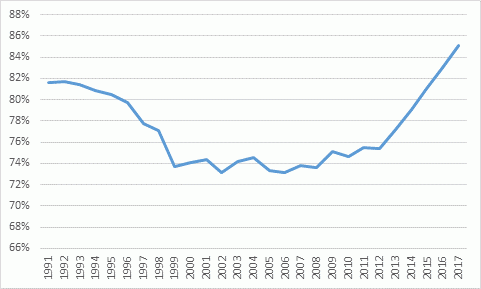
The result, simply, is that at present rates of expenditure and income growth, compensation will rise from 75% of the budget in 2012, to 85% of the budget in 2017. Or, put another way, to make room for compensation growth, universities will have to cut their non-salary budget items by nearly a third over the next few years.
And that’s why, despite faculty unions being correct about the salary growth having been affordable up to now, the evidence still points to present salary mass growth as being unsustainable going forward. The two stores are not mutually exclusive.
 Tweet this post

Hi Alex:
This is a very interesting post.
1. Can I just confirm that figures are for the university sector only (i.e. colleges not included) and for Canada as a whole?
2. Also, what’s the primary data source(s) for these figures?
Hi Nick.
1. Yes and yes
2. FIUC. If it’s university expenditure, it;s almost always FIUC.
Figure 4 reminds me of the truism that if things can’t go on like this, then they won’t.
You’re just asking for further arguments here of course in jumping from academic to total salary. Can you not show the trend for total compensation for academics? They’re just going to argue that the compensation trend you show represents growth in non-academic compensation.
They’re probably also going to argue that growth in costs over 1998-2012 should be compared to growth of enrollments.
Hi Jim. Unfortunately I can’t. FIUC does not separate out benefits to academic and non-academic staff. However, I will note that in 2012, the percentage of operating budget going to non-academic staff fell to a 20-year low. For more info on long-term trends, see here: https://higheredstrategy.com/?s=%22Financing+Canadian+Universities%22
Thanks again, Alex.
I think you are using a straw men here. No one is arguing that salaries+benefits overall are changing as percentage of budget. The question is whose salaries? The sense “in the trenches” is that while actual rank-and-file faculty salaries are not even keeping pace with inflation, the number of central administrators, management and deans of all shapes and kinds is growing and so do their salaries. So unless you have data on the rank-and-file vs management divide, you stats here are somewhat misleading.
Hi Ella. Thanks for writing.
You can see the long-run trends in academic vs. non-academic salaries here: https://higheredstrategy.com/administrative-bloat/. The proportions spent on salary for these two did change about 15 years ago but have been pretty constant since. I also just checked FIUC: in 2012, non-academic salaries as a proportion of operating grants hit a 20-year low. As for Senior Admin, their salaries typically form between 1 and 2% of salary mass (i.e. they;re not going to affect the trend very much) – data is scarce but from what I can make out, for every $3 that academic pay goes up, senior admin pay goes up about 4%. Again, not going to affect macro trends very much.
“The sense “in the trenches” is that while actual rank-and-file faculty salaries are not even keeping pace with inflation”
I don’t know where you work, but the sense at my institution (a large ON uni) is that we’ve had rich increases, one of which was larger than the union even hoped for; they secured it nonetheless due to the incompetence of the management’s side in the negotiations. I’d be the last to say that faculty have had it bad *financially*, at my institution, in recent years.
Another feature of that upper administration (now gone, thankfully) was their knack for gratuitously insulting their own faculty, seemingly at every possible occasion. Doesn’t cost a dime not to do that.
Yes, it was an odd mix…