

So, the more stat-minded among you may have noted the release, this past Tuesday, of Statistics Canada’s 2012 Survey of Financial Security (SFS). Though the main talking points were largely about mortgage debt, it also contained some interesting statistics on student debt.
Now, remember that these are figures on outstanding student debt. Some of it will be in repayment (i.e. held by graduates now in the labour force), and some of it will not (i.e. held by current students). The way to think of these debt figures is as a collective portrait of people who borrowed in the decade or so prior to the snapshot, and who had not yet fully repaid their debt (because those who had successfully completed repayment would be out of the sample). So the 2012 figure for student debt is actually a collective picture of the outstanding debt of everyone who borrowed in the period 2002-2012, and who had not yet repaid, the 2005 figure covers the period 1995-2005 or so, etc., etc.
Anyways, the headline that the usual suspects would like you to focus on is the one about aggregate debt outstanding: $28 billion, up by $5.5 billion (23%) in real dollars since the last time the study was conducted, in 2005. Why is that a big deal? Because! $28 Billion! Big Number! But a slightly more intelligent look at the data shows a different story.
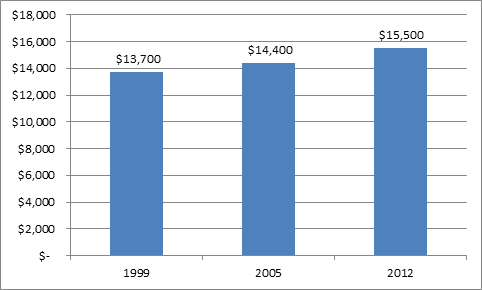
Figure 1 shows that the average outstanding student loan was about $15,000. That’s up about 6% from 2005, and 13% from 1999 (again, all figures are inflation-adjusted). Why is this figure so much smaller than the one for total debt? Simple: more people have outstanding student debt than in 2005, so it’s divided among a larger population. That might be because people are taking longer to repay their loans – more likely, though, it’s a reflection of the fact that student numbers as a whole rose substantially over the 00s.
Figure 1 – Average Student Debt Among Holders of Outstanding Student Loans, in $2012
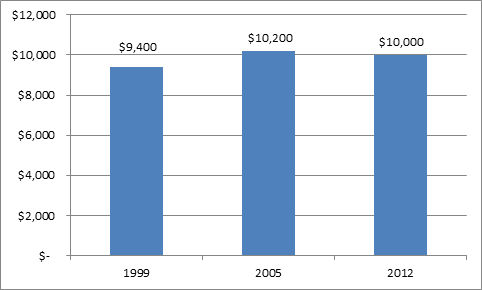
Intriguingly, the data for median student debt (that is, the mid-point value, rather than the mean) tells a slightly different story, in that it fell 2% between 2005 and 2012 (though it has still risen a bit since 1999).
Figure 2 – Median Student Debt Among Holders of Outstanding Student Loans, in $2012
How should we interpret this? This isn’t the easiest data to unpack. It probably means, as I pointed out back here, that student debt hasn’t been increasing. But it also might mean that debt repayment rates have been increasing along with indebtedness, or (less likely) that a greater fraction of student loans are held by individuals who graduated from shorter programs.
Whatever the truth, what we do know for sure is that young people aren’t drowning in student loan debt. Among family units headed by people under-35, only a quarter hold a student loan, and the loan debt constitutes just 5.3% of their total debt, down from 6.7% in 2005. Whatever the effects of student borrowing is, it would appear that deterring graduates from taking on ever-larger mortgages isn’t one of them.
 Tweet this post
