

You may recall that in last Friday’s blog I was looking at scientific output of world-class universities. I could do that thanks to quite an excellent database available from Leiden University’s Centre for Science and Technology Studies, developers of the excellent multi-dimensional Leiden Rankings, which do a strong job of comparing university research output and impact. I have covered this output and impact a couple of times before back here and here. This same data can be used to compare Canadian institutions – or at least the 28 institutions whose research output is large enough to make the rankings. And so today I thought I’d share some of that data with you.
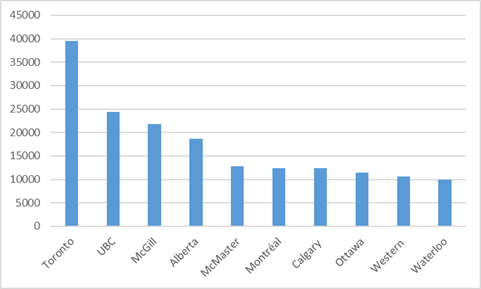
Let’s start with raw output. Figure 1 shows total publications over the most recent four years for which we have data (2012-2015). No surprise here – the University of Toronto produces by far the most publications (nearly 40,000 over four years using a non-fractional count), followed by UBC and McGill. The top eight institutions are the same eight which make the Shanghai Rankings; ninth and tenth spots go to Western and Waterloo.
Figure 1: Top Ten Canadian Institutions, Total Publications, 2012-2015
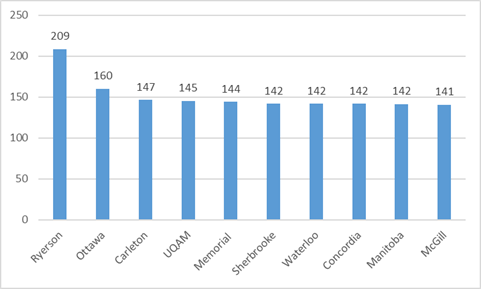
We can examine publications not just in terms of absolute output but also in terms of increase over the past decade. Recall from our discussion last week that overall indexed research output across the global top 200 institutions increased 44% between 2006-09 and 2012-2015, due mainly to improvements in index coverage and the expansion of open access publishing. As figure 2 shows, only two Canadian institutions – Ryerson and Ottawa – saw their research improve by as much as the global top-200 average. Queen’s, Windsor, and New Brunswick were the three institutions which saw the smallest increases in total output
Figure 2: Top Ten Most Improved Canadian Institutions, Publications 2012-2015, 2006-09 = 100
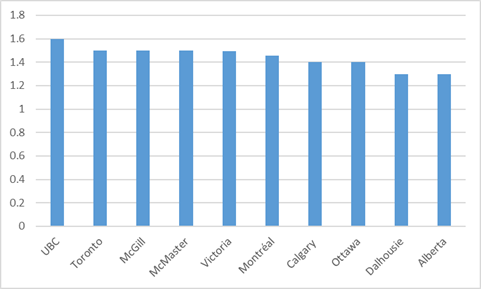
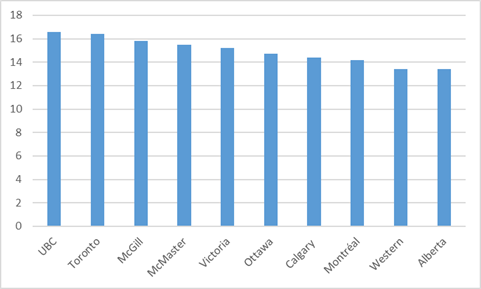
In addition to simple publication counts, we can look at impact through the use of Mean Normalized Citation Scores. A citation score is simply a measure of how often a paper has been cited – a normalized citation score is simply one that controls for the differences in disciplinary citation practices (astronomers cite each other a lot; English professors less so). On this measure it is UBC which comes first rather than Toronto. Most of the top ten here are the same as for output, but with Victoria and Dalhousie replacing Western and Waterloo.
Figure 3: Top Ten Canadian Universities, Mean Normalized Citation Score Publications 2012-2015,
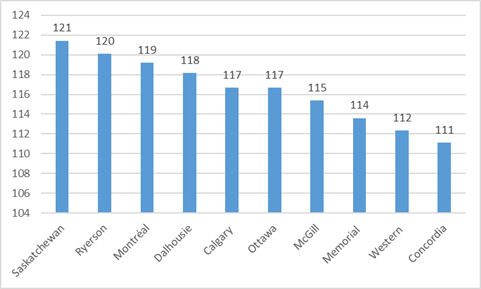
Again, we can look not just at top institutions but most improved institutions. This is quite a different list, topped not just by institutions that are outside the top ten to begin with (and hence presumably have more room to improve) such as Saskatchewan and Ryerson but also institutions which were already doing very well, such as l‘Université de Montréal. Interestingly, while few universities improved faster than the world average in terms of publications, nearly all of them did in terms of citation scores. Only three institutions – Queen’s, Polytechnique, and Carleton – failed to do so.
Figure 4: Top Ten Most Improved Canadian Universities, Mean Normalized Citation Scores 2012-2015, 2006-09 = 100
Another way to measure impact is to look at the proportion of papers published at an institution end up in the top 10% of the most-cited papers in their field, which I show below in figure 5. In terms of top institutions, this mostly shows the same result as the citation scores (figure 3): UBC first, followed by Toronto, McGill, McMaster and Victoria.
Figure 5: Top Ten Canadian Universities, PP (10%), 2012-2015.
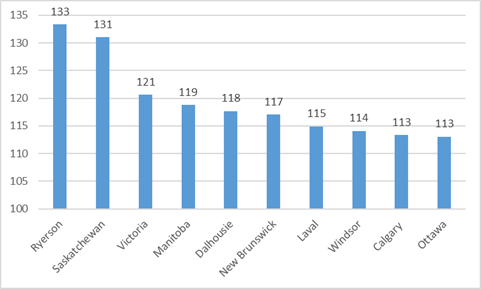
But in terms of “most improved” it’s a slightly different story. Ryerson and Saskatchewan still come top as they did for citations (see figure 4), but it’s a quite a varied group after that: Victoria, Manitoba, New Brunswick and Laval. As with citations, nearly all Canadian institutions improved relative to the global average: the only exceptions were Guelph, Queen’s and Carleton.
Figure 6: Top Ten Most Improved Canadian Universities, PP (10%) 2012-15, 2006-09 = 100
Anyways, there you have it. The usual suspects at the top of the publications and influence chart (though with Victoria making an unexpectedly strong showing), Ryerson and to a lesser extent Saskatchewan as the country’s most improved, and Queen’s alone in going backward in all three categories.
Who says bibliometrics aren’t fun?
 Tweet this post
