


Just a quick note: next week, I’ll be on that all-too-common transportation route, Toronto-Milwaukee-Shanghai, en route to attend (and deliver a paper at) the 6th International Conference on World-Class Universities, and the blog will be on hiatus while I’m away. Anyways, to business.
Everyone knows that for dependent students – that is, students less than four years out of secondary school, or who have not spent two consecutive years in the labour market full-time – the amount of student assistance available depends on parental income. And that’s mostly true. But there are some catches.
Back to first principles for a moment. Student assistance is based on something called “assessed need”, which is simply “assessed costs” (tuition and fees, plus an estimate for books/materials costs, plus an allowance based on place of residence) minus “assessed resources”. If you’re a dependent student, one of your assessed resources is something called “expected parental contribution”. This amount has nothing to do with what your parents actually contribute: it has to do with what the government assumes they can contribute based on their income.
On what do governments base these assumptions? First, governments assume that parents need a minimum amount of money on which to live – this is known as the “minimum standard of living” or MSOL. This figure is meant to buy the same basket of goods across the country (meaning that MSOL is higher in high-cost provinces) and is equivalized for household size (meaning that larger households have higher MSOLs). Parents are not expected to make contributions on MSOL, but they are expected to make contributions above it at an escalating rate.
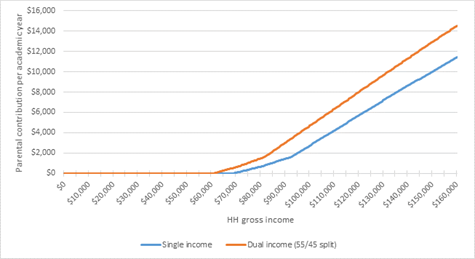
But MSOL is based on taxable income, meaning it’s not just total parental income that matters, but also the income split between family members. A two-parent family where the two parents earn $45,000 and $55,000 pays less tax than one in which a single wage-earner brings in $100,000, and hence have higher post-tax income. A student from the two-income family in this example will therefore have a higher “expected contribution” and, ceteris paribus, lower student aid than a student from a one-income family. Figure 1 shows how much aid students from one- and two-earner families get at different levels of family income (the figures are accurate for Manitoba, but roughly the same relationship holds across all provinces). Basically, beyond about $90,000 in family income, the expected contribution of the one-income family is $2,000 less than that of the two income family – and hence their child will be eligible for a similarly greater amount of student aid.
Figure 1: Expected Parental Contribution by Parental Income, Single- and Dual-Income Families
What is more interesting, perhaps, is to look at how the rules differ across provinces. Figure 2 shows expected parental contributions by province, by family income (assuming a two-parent, one-child, two-income family, with an income-split as outlined in the previous paragraph). What it shows is that parental income affects student aid eligibility in very different ways in different parts of the country.
Figure 2: Expected Parental Contribution by Family Income, Selected Provinces
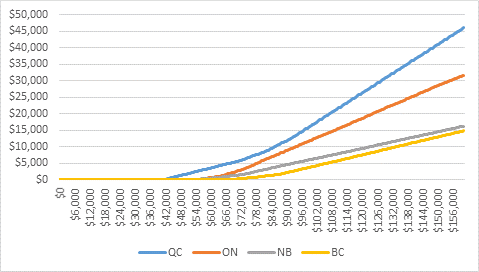
It is well-known that expected parental contributions in Quebec are much higher than they are in the rest of the country. The province’s reputation for having a generous student aid program is only true for independent students; high expected parental contributions actually make aid very difficult to obtain for dependent students, especially in CEGEP (which may go some way to explaining that group’s notorious radicalism). Compared to British Colombia, the MSOL threshold is $26,000 lower ($41,000 vs. $67,000); not only that, but also the rate at which contributions are expected to increase is faster in Quebec. At $90,000 of family income, a BC family would only be expected to contribute $2,150; in Quebec, the expected contribution would be almost $12,000 (which, in effect, would disqualify a student from aid altogether).
BC and New Brunswick have similar-shaped curves in Figure 2, and the curves of all but two other provinces resemble them closely. The first is Ontario, which uses a different and more restrictive parental contribution formula than the rest of the country. In fact, in many respects, Ontario is like Quebec in that it has a very generous system of grants, but restricts access to them by having higher expected parental contributions. At $90,000 in family income, an Ontario family would be expected to contribute almost $9,000 per year to their kids’ education (again, compared to just $2,150 in British Columbia).
The other exception is Alberta, which recently decided that parental contributions are a complication it could do without, and so abolished them a couple of years ago. Sounds great, right? Of course the reason Alberta could make such a decision is that it doesn’t cost them very much since, for most students, its system is all loan and no grant. Take the cons with the pros.
There. You now know more about this than I do (on this subject, my brain is officially subcontracted to Jacqueline Lambert, who created these awesome graphs); use the knowledge wisely. See you all when I return.


3 Responses
Good blog post, Alex. Question: how did you arrive at the numbers in Figure 1? Are they weighted averages based on provincial figures, or are they in reference to the federal side only?
Hi Nick. As I think it says in the text, they are the )joint federal-provincial) figures for MB, but this relationship holds across the country. You’d just shift the curve left or right a few thousand dollars.
Thank you, Alex.