

Just for giggles the other day, I took a look at Canadian university expenditures in 2013-14 using (as usual) the CAUBO/Statscan Financial Information of Universities and Colleges Survey. I looked at operating expenditures by category. Then I normalized them per FTE student. And I got some very weird results which I thought I would share with y’all.
What I am going to do in this series is show you the results for the main categories of expenditure which are “non-academic”. I am not going to look at the categories known as “instruction and non-sponsored research” or “non-credit instruction”, because those vary significantly according to the mix of disciplines offered at an institution. Instead, today I am going to restrict myself just to the categories “Library”, “Computing”, “Physical plant”, and “Student Services”; tomorrow I will look at the more complicated cases of “Administration” (meaning central administration), and “External Relations” (meaning both government/public affairs and fundraising/alumni relations).
(btw – the data is from 2011-12 because we haven’t updated our PSIS file lately. The numbers presented here are a bit dated, but the basic picture hasn’t changed.)
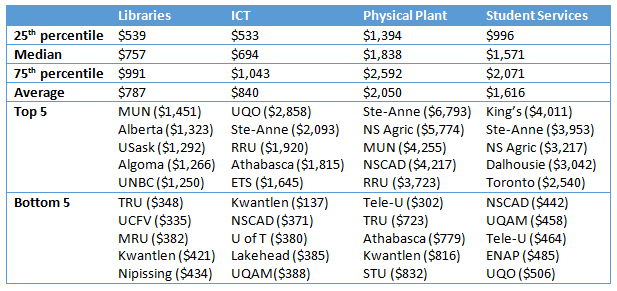
The following table shows the key elements of the comparison. The intriguing thing here is that institutions actually seem to have very different patterns of spending. In all four categories, the difference in per-student spending between an institution at the 75th percentile is twice what it is at the 25th percentile. I’m not sure I would go so far as to say that institutions are using different strategies of non-academic spending to meet their mission – it’s not clear that these spending variations are occurring in a conscious manner – but it is certainly true that institutions are exhibiting quite different patterns of spending.
So, a variety of thoughts here:
- The universities with the lowest-spend in Libraries are all small-ish, new-ish (post-1992) institutions; those with the highest spending are more of a mix.
- Athabasca and RRU near the top of the ICT spending charts is not a surprise; what is a little weird is seeing Université du Québec en Outaouais in top spot. Also, why is U of T near the bottom? ICT is one of those fields in the FIUC survey which is prone to bad comparisons (some institutions stick a lot of the salary costs related to ICT in their central admin numbers or occasionally in their faculty expenditures, if staff are based in the faculty – a quirk of the way the data is compiled), so it might be that. On the other hand, expenditures on ICT might just scale a lot better.
- The student services numbers are fascinating: 4 of the 5 top-spending institutions are in Nova Scotia; 4 of the 5 lowest-spending institutions (and 7 of the top 10) are in Quebec.
- The physical plant numbers are the hardest to interpret because in a sense these are in some ways legacies. NSCAD owns some historic properties with high upkeep and doesn’t have a lot of students and so has high per-student costs. Kwantlen is a relatively new institution and therefore doesn’t need to spend a lot on upkeep (or heat – institutions in the lower mainland have a big cost advantage because of the climate)
There are a couple of ways to look at these numbers overall. There’s the competitive-bidding aspect: some will look at these numbers and say “why isn’t our institution spending that much? Gotta keep up with the Joneses!” But there’s an efficiency angle, too. Those institutions spending at the 75th quartile and above – what are they getting for their money that other institutions are not?
Maybe the most interesting case is Libraries. A lot of big Ontario universities have very low library costs: Guelph $473/student, Waterloo $591, McMaster $688, Ottawa $723, Western $749, all of which are below the national average. You might think the big difference is in the collections budget – and it’s true those are lower, in part because there is a lot more collections-sharing between institutions in Ontario than is possible in places like Saskatoon or St. John’s, which don’t have nearby neighbours. But the biggest single cost in Libraries is salaries, which makes up 45-65% of any university library’s budget (higher in Quebec). The real difference between these institutions is therefore staffing. So do users notice the difference? If so, which users and how is the difference felt?
More tomorrow.
 Tweet this post

Those student services numbers look off. Is the average really above the 75th percentile and $500 above the median?
Thanks for catching that. Cut/paste error. Will fix shortly. $2,071 is the 75th percentile, average is $1,616.
For the student services, are you splitting out what most people think of as services (salaries and benefits) from the SFA figure?
CAUBO’s overall student services number includes SFA and that can really warp the picture especially for institutions that give a lot of SFA from operating.
Good point. Thanks. have clarified this in today’s blog.