

As you all know, I spend a lot of time analyzing university finances, mainly because the data is easy to get and is quite detailed (Canadian higher education statistics are disastrous in many ways, but one area where our stats are better than almost anywhere else in the world is our institutional financial reporting – the FIUC Survey is genuinely world-class). But I normally don’t spend the same amount of time on community college, which is something I’d like to change starting today.
Figure 1 shows the basics. Over the past 15 years, the Canadian college system has gone from being an $8 billion/yr enterprise to being an $11 billion/yr one. Between 2001 and 2010, the systems’ different revenue streams were all growing at roughly the same rate: money from government (97% or so of which is from provincial governments, with very small amounts coming from federal and municipal levels) constituted roughly two-thirds of all funds, with the rest divided more or less equally between fees and “other” income.
Figure 1: Canadian College Revenues by Source, 2001-02 to 2015-2016, in constant $2015.
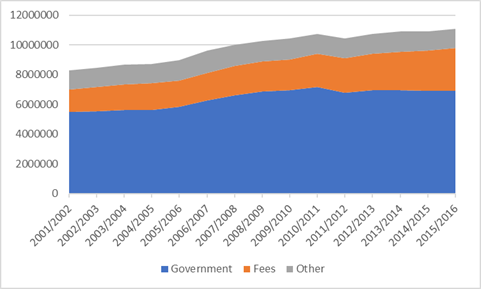
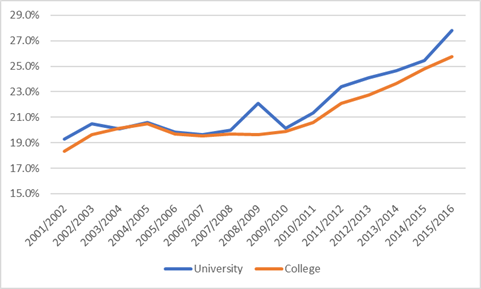
But since 2008/09, both revenue from government and “other” sources have been stagnant, and 100% of income growth has come from student fees. In that time, student fee income grew by 40%, from a little over $2 billion to $2.8 billion, and as a share of total income from 19% to over 25%. As figure 2 shows, fee income as a percentage of total income has followed an almost identical path across the two sectors – from around 20% before the great Recession to over 25% now.
Figure 2: Student Fees as a Percentage of Total Income, Colleges v. Universities, Canada 2001-02 to 2015-16
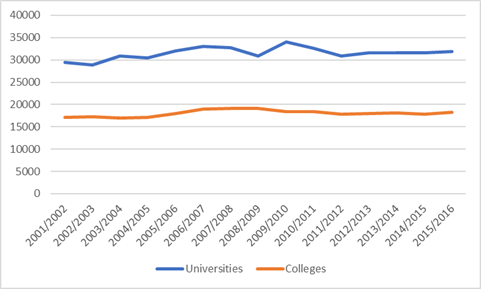
Of course, what matters is not so much total income, but total income per student. And here again we find a fairly similar pattern between colleges and universities, namely that the two sectors both saw gentle increases in per-student income in the 2000s, followed by gentle decreases in the 2010s. In the college sector, income per FTE student now stands at a little over $18,000 per head, compared to over 19,000 in 2008/09.
Figure 3: Total Income per FTE Student, Colleges v. Universities, Canada 2001-02 to 2015-16
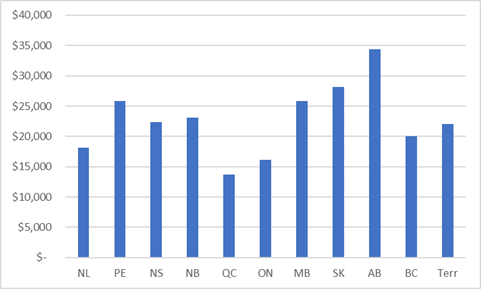
But of course, income per student varies widely across the country. In Quebec, where colleges are disproportionately arts-oriented (because they mostly serve as a pre-requisite to university), they do not need to spend much money and are therefore able to get by on under $14,000 per student. By contrast, in Alberta, where colleges are technology-heavy (mainly to serve the construction and extractive industries) and where – frankly – the provincial government has way more money to drop – per student income is two and half times higher, at over $34,000.
Figure 4: Income per FTE College Student by Province, 2014-15
In other words, while the specifics differ across the two sectors, the basic pattern is the same: significant differences across provinces, broad continuity in per-student income, and some substitution of student fees for government expenditures.
 Tweet this post

Do the graphs show real or nominal dollar values?