

Morning. Just after the blog closed for the holidays, Statistics Canada did its annual release of data from the FINCOL survey (that’s the one that asks colleges about their income and expenditure, just like FIUC does for universities, only in a lot less detail). So, as usual, I thought I would give you a look into the data.
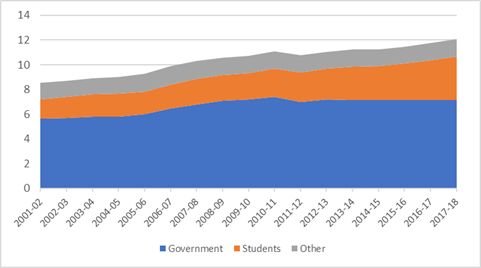
Let’s start with the big picture. Nationally, revenue at colleges increased by 2.8% after inflation, which is pretty good. It’s not quite the 7% achieved in 2006, when a couple of provinces aimed firehoses of money at the post-secondary sector (helloooo Alberta!), but it’s still the best year since 2011, so that’s something to celebrate.
Figure 1: College Income by Source, in Billions of $2017, Canada, 2001-02 to 2017-18
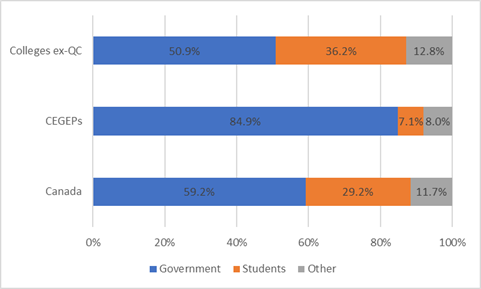
Overall, the system breaks down to about 60% publicly funded and 40% privately funded, with about seventy percent of the private funding coming in the form of fees (this is quite different from universities, which have a lot more self-generated revenue sources). But this disguises one huge difference, which of course is that Quebec – home of about one-third of college students nationally – has a very different system that is (mostly) fee-free. Figure 2 breaks the numbers down nationally, placing Quebec in a separate category. After removing Quebec, the “rest of Canada” college system starts to look a lot like the country’s university system in that it is very close to falling below the 50% mark for public funding.
Figure 2: College Income by Source, Quebec vs. Rest of Canada, 2017-18
If you want to see a downside in the data, it’s that funding from government is flat as a board since 2012. I mean, look at the line in figure 1, it’s so flat you could shoot pool on it. Take out a small spike in 2010-11 and a dip in 2011-12, and what we see is that after inflation, government support is unchanged really since 2008-09. And yet, overall income is up by $250 million this year and by about $1.5 billion over the last decade. No prizes for guessing where the extra dough is coming from: student fees (for the most part international ones).
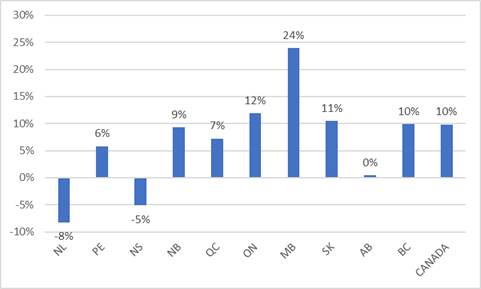
But even this year’s big increase (10% after inflation) in fee income is not distributed equally across the country. Some provinces are actually seeing substantial declines in fee income, mainly due to drops in enrolment. College of the North Atlantic in Newfoundland, for instance, appears to have lost 8% of its funding on a drop of about 1550 students (roughly 18%) between 2016-17 and 2017-18 (and if you’re wondering why Newfoundland is holding a commission into post-secondary education, this factoid is Exhibit A). Meanwhile, BC colleges saw an increase in fee revenue of 10%, Ontario of about 12% and Manitoba – hold on to your hats – 24% (albeit from a low-ish base).
Figure 3: Increase in College Tuition Fee Income by Province, 2016-17 to 2017-18, in constant dollars
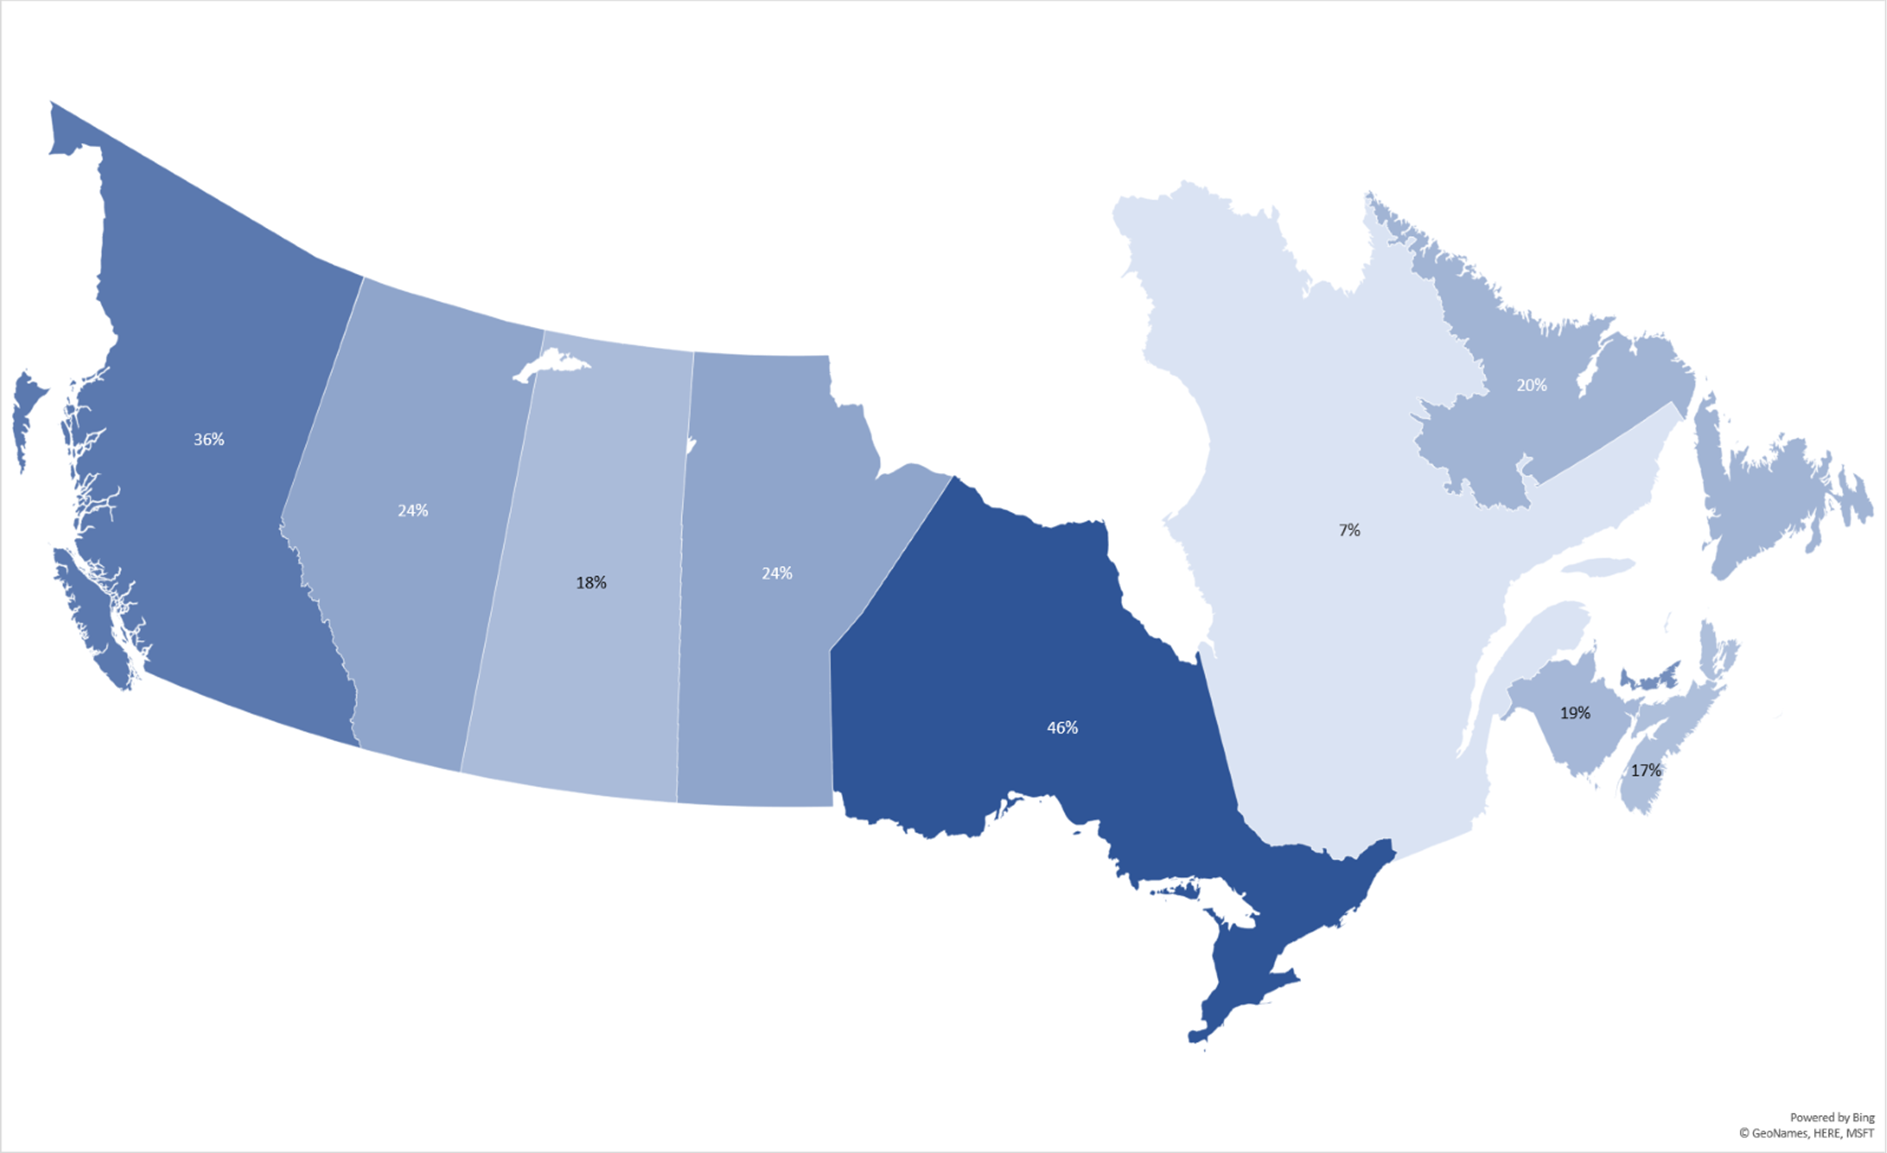
Of course, fee income is not equally important in all parts of the country. Figure 4 shows tuition fee income as a percentage of total college income in each province for 2017-2018. No surprise here, really: Ontario is nearly half-funded based on fees, most provinces are in the 15-20% range and Quebec’s fee take is close to non-existent.
Figure 4: Fee Income as a Percentage of Total College Income, by Province, 2017-18
An apposite question here is “what’s all this new money being spent on”? To answer this question, I track the change in real spending from 2016-17 to 2017-18 by category, and…well, it’s not necessarily what you’d expect. Total spending rose by nearly $500 million but spending on libraries and academic wages are actually down in real terms. Spending on non-academic staff (“other wages”) is up by 3%, spending on buildings & land up by 10% and equipment by 27%.
Figure 5: Change in Real Expenditures by Category, Canadian Colleges, 2016 -17 to 2017-18
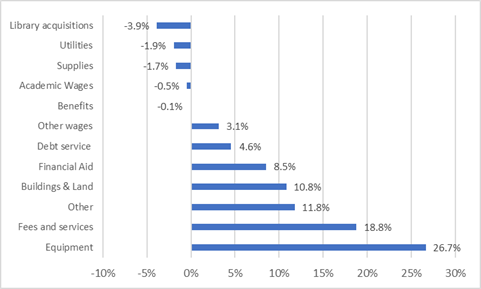
To a significant extent, then, colleges seem to be using this tuition windfall to make themselves more capital intensive. Which is completely understandable if you view this money as essentially temporary – it’s a way to spend the money productively without permanent commitments and perhaps ruinously raising your running costs to unsustainable levels. But if the shift to accept more international students is permanent, then eventually colleges are going to have to start spending more on actual instruction.
Keep an eye on these trends over the coming years.
(Note to readers: as I mentioned just before the break, I am no longer doing Friday blogs, so see you all again on Monday.)
 Tweet this post
