

A few months ago, I promised you all an update on college finances when Statscan finally got around to updating its FINCOL tables. Well, that day is here.
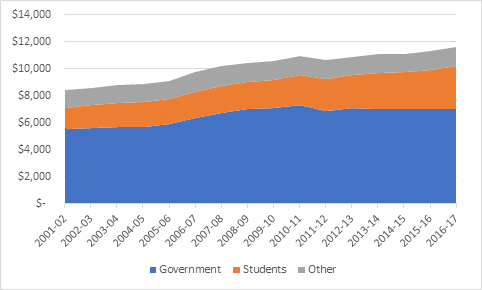
Unlike universities, which have seen their budgets grow in real terms by about 25% over the last decade, growth in college budgets has been a lot slower – only about 14% – and nearly all that growth has come from student fees, since government support has been essentially flat. In total, college revenues were just over $11.5 billion, in 2016-17, compared to $38 billion for universities.
Figure 1: College Revenues by Source, 2001-02 to 2016-17 Canada, in millions of $2016
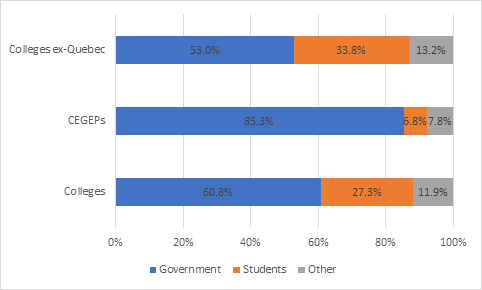
Of course, the college system differs quite a bit from one province to another. Quebec’s CEGEP system, for instance, is almost entirely unlike its counterparts elsewhere both in terms of curriculum/sequencing and financing. Simply looking at a national picture of “colleges” can obscure these differences, so in figure 2 I disaggregate the Quebec numbers from the rest. Colleges outside Quebec now generate over a third of their income from student fees (like their university counterparts) while in Quebec their contribution to institutional finances is close to nil.
Figure 2: College Revenues by Source, Quebec vs. Rest of Canada, 2016-17
Now this is the point in the analysis where I would usually start talking about -per student expenditures, but due to incompetence (or at least negligence) at Statistics Canada and the Government of Ontario, I need to make a quick detour through the crap sandwich the two of them have made of Ontario enrolment data (which matters because it’s over a third of the national total).
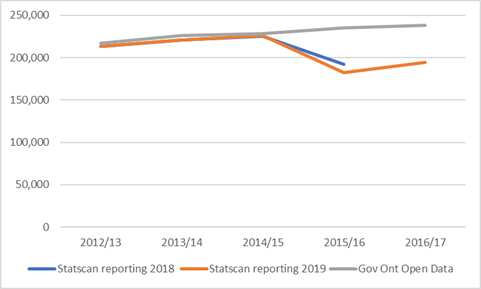
As I mentioned last year, Statistics Canada changed methodology with respect to Ontario: previously, each college had reported numbers independently and now the Ministry makes one collective submission. This led to a sudden and unexplained drop of about 30,000 FT students; I have since been told the Ontario ministry had an issue with data from one specific college (and judging by the size of the discrepancy it was almost certainly one of Humber, Seneca or George Brown). When I checked in yesterday to see if the data had been fixed, to my surprise I saw Statscan had revised the 2015/16 Ontario college data downwards again by another 10,000 students, and then recorded a rise of about 10,000 for this year. Which is odd, because the Ontario government itself, in the data it publishes via the Ontario Open Data Portal shows no decrease whatsoever in college enrolments (n.b. the Ontario figures do not specify FT or PT or both – I assume it is FT because the numbers line up so closely to the reported Statscan numbers but I could be wrong). Statscan has not seen fit to publish anything like an explanation, but this is Canada and no one cares about access in a more than rhetorical way, so it could not possibly matter to anyone if 15% of a system’s students just disappear, right?
Figure 3: A Visual Representation of How Little Anyone Cares About Good Data on College Access, Ontario Edition.
Anyways, in compiling per-student calculations I am *not* going to use Statscan enrolment data for Ontario colleges, because it’s almost certainly wrong. Instead, I will index the last decent Statscan year (2014-15) to the change shown in the Ontario open government data. This data won’t be right either, but it will be a hell of a lot closer than what Statscan is publishing.
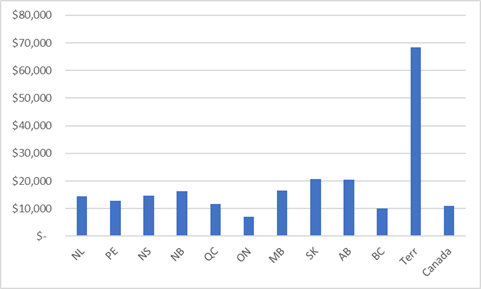
Based on suitably adjusted Statscan enrolment data, figure 4 shows what government per-student expenditures looked like across the country: as usual, Alberta and Saskatchewan are high, BC and Ontario are low. And yeah, education in the North costs A LOT.
Figure 4: Per-student Transfers to Colleges, by Province, 2016-17
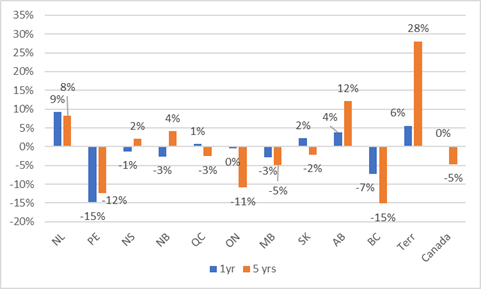
Finally, we can look at changes in per-student financing over time. Figure 5 compares this year’s funding levels to those of one year ago and five years ago. This shows a more negative picture than figure 1, because it takes growth in student numbers into account. Nationally, per-student public funding is down about 5% over the last five years, but that figure disguises very large falls of 11% and 15% in Ontario and British Columbia, as well as a counter-balancing 12% increase in Alberta (there is also a very weird decrease in PEI which I suspect is not in fact real, but I don’t know enough about that province to correct the data).
Figure 5: 1- and 5-year Changes in Per-student Provincial Transfers to Colleges, by Province, 2016-17
So, there you go folks: all this year’s key college finance data altogether in one place. Have a good week.
 Tweet this post
