

If you’re ever bored and playing around with CAUBO data (what do you mean, “no else does that”?) you may have noticed that in 2011 there was a significant (roughly 3%) decrease in university expenditures – which is weird, because no province significantly reduced funding to universities that year, and universities never voluntarily reduce their spending. So what the heck is going on?
The quick answer is: the Knowledge Infrastructure Program (KIP) ended, and so institutions lost a nice little source of income that they could devote to making newer, nicer, and more energy-efficient buildings. But a deeper look at some of the numbers on capital spending makes for interesting reading.
Here’s the overall story on capital expenditure at Canadian universities:
Figure 1: Capital Expenditures at Canadian Universities, 1992-2011, in $2011
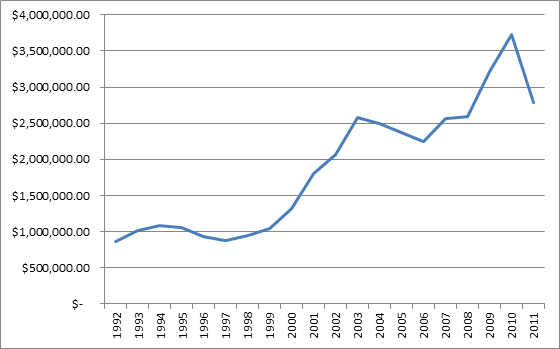
Obviously, this graph shows the enormous effect of KIP – an enormous two-year spike in spending in 2009 and 2010. But to me, the more interesting thing is the long-term increase in capital spending. Back in the 1990s, we basically kept capital spending at around a billion dollars/year. Come the millennium, we changed tack. Over the next three years, capital spending jumped by 150%, nation-wide, and stayed there. Part of that was of course the result of Ontario going on a double-cohort-related construction spree. But it wasn’t just Ontario – remember that enrolments went up by about half between 1997 and 2009. And of course, from 1999 onwards, Canada Foundation for Innovation money started flowing into institutions across the country to upgrade institutions’ research infrastructure.
Here’s what happened to spending in the four big provinces which make up 90% of the country’s post-secondary expenditures:
Figure 2: Capital Expenditures at Universities in Ontario, Quebec, British Columbia and Alberta, 1992-2011, in $2011
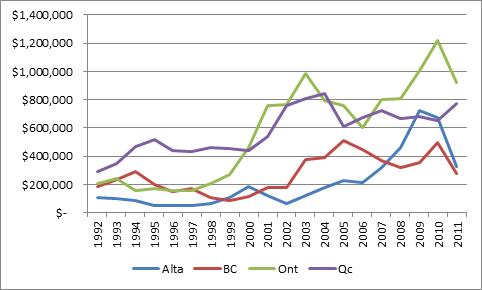
Figure 2 shows that although the big increases were in Ontario and Alberta; Quebec stands out for having a policy of very steady investment in capital. It had a one-off increase in 2000 (one assumes this is mostly due to CFI), but other than that the expenditures were quite stable. That means Quebec wasn’t a stand-out performer in 2010, but it also means that for most of the 90s, Quebec was outspending Ontario 2:1 (and thus it probably didn’t have the same kind of infrastructure deficit going into the 2000s).
But maybe the mind-blowing thing here is what happened in Alberta post-2000, which is best seen by isolating the later years in the previous graph and indexing provincial spending:
Figure 3: Capital Expenditures at Universities in Ontario, Quebec, British Columbia and Alberta, 1999-2011, indexed to 1999
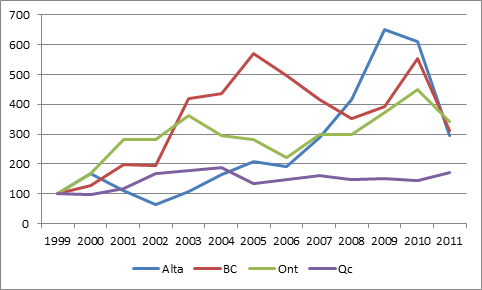
Figure 3 illustrates two extraordinary spikes in spending: BC, where capital spending quintupled between 1999 and 2005, and Alberta, where capital spending triples in just three years after 2006.
The long and the short of it is that in the 2000s, for a variety of short-term reasons (double-cohort in Ontario, having more money than God in Alberta), capital expenditures settled at a level about 2.5 times where it was in the 90s. Can we stay at this level, or are we doomed to give in to short-termism and start diverting this money to shorter-term priorities? Certainly, a number of faculty unions (particularly in the Atlantic) have been making the case that capital expenditures should be re-directed to higher faculty salaries.
One can’t predict the future, of course. But these figures really do remind you that the mid/late 00s were the Golden Years for Canadian higher education financing. Makes you wonder how many people now feel silly for not having seen it at the time.
 Tweet this post

Were the greater expenses in part a response to deferred maintenance? In that case, one would expect a huge increase when money became available, and then a reduction after the deferred maintenance and resulting damage had been repaired.
Are those dollar amounts in $K? I would have thought capital expenditures would max out close to $4 billion nationally, rather than $4 million. Otherwise, an interesting analysis.