

Remember how, in 2012, tuition in England rose by about $10,000-$12,000 (depending on the currency exchange rate you care to use) for everyone, all at once? Remember how the increase was only offset by an increase in loans, with no increase in means-tested grants? Remember how everyone said how awful this was going to be for access?
Well, let me show you some interesting data. The following comes from UCAS, which, at this time of year, does daily (yes, daily!) reports on “accepted applicants” (that is, applicants who have been offered a place at universities for the term commencing in a couple of weeks). Figure 1 shows what’s happened to student numbers from families in the lowest income quintile since 2011, which was the year before the tuition increase.
Figure 1: Number of Accepted Applicants from the Lowest Income Quintile, England, 2011-15
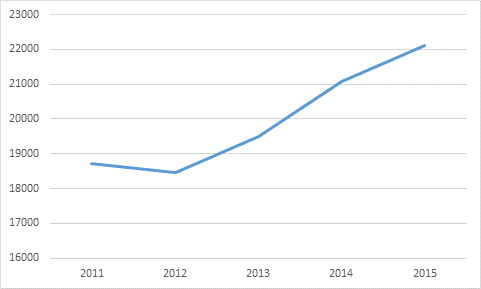
Big increase, right? Over three years, it amounts to 19.8%.
“Oh well”, say the zero-tuition true believers, “this doesn’t prove anything. What really matters is what happened to students from higher income backgrounds. Surely, being less bound by financial constraints, their numbers grew even more”.
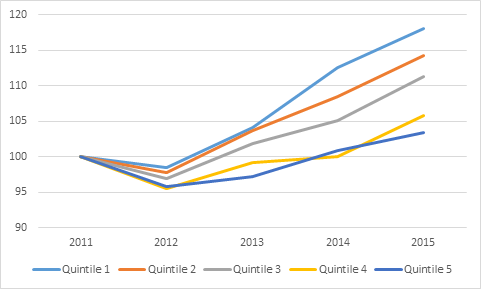
In a word: nope. The rate of accepted applicants increased by more than three times faster for students from the bottom quintile (quintile 1) than it did for those from the top (quintile 5). Of course that’s partly because they have a lot more room to grow: there are still about three times as many accepted applicants from the top quintile as the bottom quintile. But the point is: contrary to expectations, the gap is closing.
Figure 2: Change in Number of Accepted Applicants by Income Quintile, England, 2011-2015, Indexed to 2011
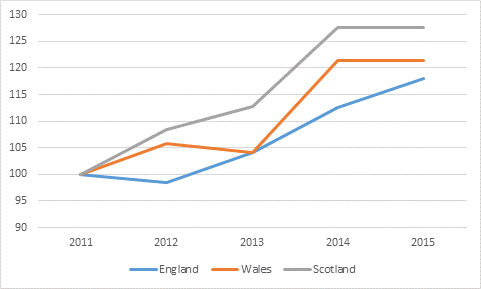
“Ok”, say the skeptics; “let’s look at counterfactuals: what’s going on in neighbouring countries, where policy didn’t involve a massive tuition fee increase? What about Wales, where tuition stayed at a little over £3,000, or Scotland where tuition is free (for Scots: English kids still have to pay the £9,000)?”
Fair question. Figure 3 shows what happened to students from the lowest income quintile in all three countries: in Scotland, rates of accepted applicants are up by 28%, in Wales by 21%, and in England by 17%.
Figure 3: Change in Rate of Accepted Applicants, England, Scotland, and Wales, 2011-15, Indexed to 2011
“A-HA!” Say the usual suspects. “Clear evidence that free is better!” Well, maybe. But before declaring victory, why not look at rates of accepted applicants for low-income students across these three countries? That is: what percentage of all youth from the bottom income quintile actually reach the stage of being “accepted applicants”?
Figure 4: Accepted Applicants from Bottom Quintile Families as a Percentage of all Bottom Quartile Youth, England Scotland, And Wales, 2011-2015
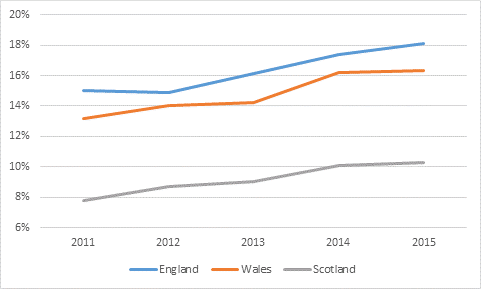
Quite a different story, isn’t it? Turns out that in horrible, vicious, neo-liberal, £9,000 tuition England, 18% of lowest-income quintile youth apply, and are admitted to university. In idyllic, equality-loving, £0 tuition Scotland, the figure is not much more than half that, at 10%. So let’s just say that the evidence claiming fees explain participation rates, and changes thereof, is pretty limited.
But getting beyond the issue of fees, I think there’s a bigger story here. Right across the UK, regardless of tuition fee regime, there is a massive uptick in participation from low-income students over the last couple of years. Clearly, something is going right there with respect to low-income students. Is it a change in aspirations? Expectations? Academic preparation? As far as I know, no one has published on this – I have a feeling everyone was so keyed on explaining expected declines in participation that no one was set up to explain the opposite. But whatever is going on, it’s a success, and other countries would do well to learn from it.
 Tweet this post

I wonder if some of the lower-income uptick can be a long-delayed result of the AimHigher/Excellence Challenge programme, which worked intensively with schoolkids in the lowest-participation schools? As AH evolved, it targeted younger and younger children, after finding that students 14 and older had already decided whether or not they were university material. The National Foundation for Education Research did some fascinating evaluations of AH. The government axed the programme in 2011.
I suspect that’s part of the story, yes.
These graphs tell us nothing about the impacts of fee hike. You display no counterfactual whatsoever. The upticks for the poor could have been much larger, meaning that the impact was negative. You simply don’t know. How can you responsibly call this a success other countries should learn from??
Sara, I’m not sure if you’re just not reading the text or what. You have a case where you have significant and largely parallel gains in low-income participation in three separate jurisdictions, each of which has a distinct fee policy (and hence can act as counterfactuals to one another), within the same nation-state. What that tells me is that there is something going on in all three jurisdictions which is much more important that whatever the fee policy is. I don’t know what that “something else” is (delayed effects of Aimhigher? OFFAs work? who knows?) but that something else is clearly pretty powerful.