

I made a little remark last week to the effect that on present trends, student fees would pass provincial funding as a source of revenue for universities by 2020-2021 and combined fed-prov government funding by 2025. Based on my twitter feed, that seems to have got people quite excited. But I should have been a little clearer about what I was saying.
First of all, by “on present trends”, I literally meant do the simple/stupid thing and take the annual change from 2014-15 to 2015-16 and stretch it out indefinitely. One could use longer-term trends but for provincial government funds, the difference is minuscule because the 1-year and 5-year trends are pretty similar. It’s harder to do that with the federal money because it jumps around a lot on an annual basis (is there a federal infrastructure program in a given year? Have they given a one-time bump to granting council dollars? etc.) and so medium term trends are harder to discern. Second, when I said it would pass government funding, I meant for the entire budget, not just the operating budget (feds don’t really contribute to operating budgets). And third, I was speaking in terms of national averages: regional averages vary considerably and in some provinces, fees passed government grants as a source of income some time ago.
Anyways, I thought it would be fun to do some inter-provincial comparisons on this. To make things simple, I’m going to exclude federal funds from the exercise, and just look at provincial grants and student fees. As previously, the data source is the Statcan/CAUBO Financial Information of Universities and Colleges Survey.
Let’s start by looking at how grants and fees compare to the size of the operating budget of universities in each province.
Figure 1: Provincial grant and fee income as a percentage of operating income, by province, 2015-16
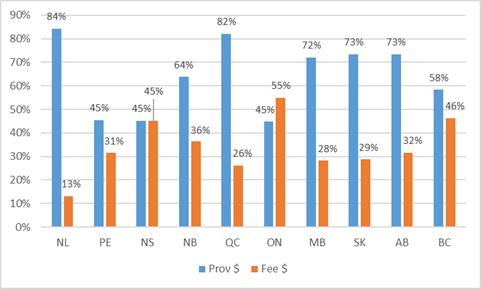
Now, remember: some provincial and fee income goes to areas other than the operating budget and operating income is not restricted to just student fees and government grants. Thus, you shouldn’t expect the two sets of lines to add up to 100%. In some cases they add to more than 100%, in some cases less. But no matter, the point is here that already in 2015-16 fees represent a greater portion of the operating budget than government grants in Ontario and an equal proportion in Nova Scotia. In BC and PEI, fee and grant income are close-ish, but in the other six provinces government grants predominate.
Now let’s look at the five-year percentage change in income, in real dollars, from fees and grants. This one is kind of complicated, so bear with me.
Figure 2: Change in income from provincial grants and student fees, by province, 2010-11 to 2015-16
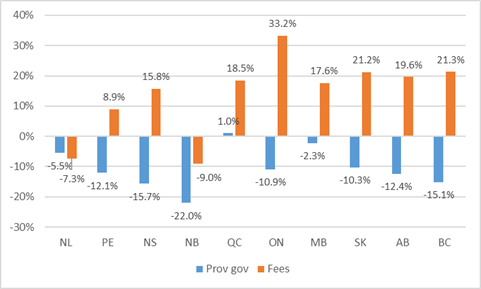
There are seven provinces which share a pattern: increasing real fee income and decreasing real provincial grant income, though the extent varies. The biggest shifts here are in Ontario and BC. Quebec is the only province which has seen an increase in income from both sources. In all eight of these provinces, we can do straight-line projections of the future pretty easily.
But then there are two provinces – Newfoundland and New Brunswick – which have seen net decreases in both sources of income. Basically, this is what happens when a demographic collapse happens at the same time as a fiscal collapse. In per-student terms this doesn’t look quite so bad because enrolments are declining, but since staff don’t get paid on a per-student basis that doesn’t help much when it comes to paying the bills. It’s hard to do straight-line projections with these two because it’s quite clear the fee income declines aren’t going to continue indefinitely (the demographic collapse stabilizes, eventually). So we’re going to say good-bye to these two for the rest of this analysis, while wishing them the very best in dealing with their rather significant challenges.
Ok, for the remaining eight provinces, let’s combine the info in those last few graphs. Let’s take the income by source data in figure one, and then apply the trend changes in figure 2 to each province. The easiest way to show this in a graph is to show fee income as a percentage of provincial grant income. We can show this out to 2024-25, as seen below in figure 3.
Figure 3: Projected ratio of student fee income to government grant income to 2025, by province
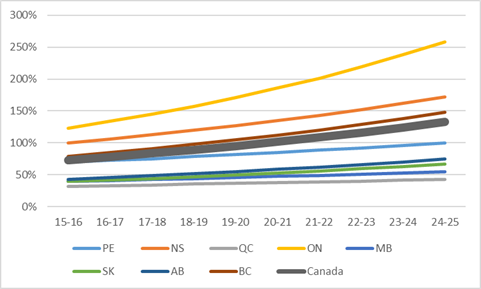
What figure 3 really shows is that Canada is heading towards a much more financially heterogeneous higher education system. For the country as a whole, fee income for universities should surpass provincial government grants in 2020-21. But this masks huge variation at the provincial level. Ontario and Nova Scotia (by now) already exceed that level. BC will get there in three or four years, PEI will get there by 2024-25. But the other provinces aren’t on track to hit that level until 2030 at the earliest (and in Quebec’s case it’s about 2055).
Another way to think of this is that in about a decade’s time, the funding landscape in places like Quebec, Manitoba and Saskatchewan is going to look the way it did in Ontario ten to fifteen years ago. At the same time, Ontario’s funding landscape is going to look a lot like big American public schools, with less than 30% of the operating budget (and probably something like 15% of total funding) coming from provincial governments. Differing incentives facing different universities means they are probably going to be run quite differently too: expect a greater variety of institutional cultures as a result.
Now, as with any straight-line projection, you should take the foregoing with a healthy amount of salt. Politics matter, and funding trajectories can change. This is one possible scenario, not necessarily the most likely but simply the one most in line with current trends.
But keep in mind that the above is the probably good news scenario for Ontario. The bad news scenario would see the percentage of funds coming from fees restricted not by increasing the government grant, but by restricting student intake, or the intake of international students (which is where the big gains in fees are really coming from). So even if you find this scenario disturbing: be careful what you wish for.
 Tweet this post

Really useful comparisons, thank you. As I read CAUBO data, on the revenue side it identifies total “tuition and other fees” revenues without subtracting give-backs to students (“Scholarships, bursaries and prizes”) so is not a clear picture of students’ net tuition costs after grants, tax deductions, bursaries, etc. Consequently makes Ontario and Nova Scotia look comparable at the high end, but wouldn’t Ontario students net out at a much lower cost level on average than students in Nova Scotia because of much more generous student aid? Might be a lot of work, but would love to see a table estimating what net student tuition fees represent as a proportion of university revenues – I would expect Nova Scotia to stand out in such a comparison. And interesting to see the 5 or 10 year trends.