If you’re one of those people who obsessively follows stories about student debt, it’s possible you’ve heard some rumblings about the latest Canadian University Survey Consortium (CUSC) survey, which seems to show a drop in student debt over the last three years.
CUSC is an important source of information about student debt in Canada. Every three years, this consortium surveys a few tens of thousands of graduating students, and asks them (among other things) about their outstanding student debt. We need this source of data because the National Graduate Survey only comes out every five years (too infrequent for most policy purposes), and the feds and provinces have yet to come up with a way to jointly report debt statistics (joint reporting being necessary, given that students receive loans both from federal and provincial governments).
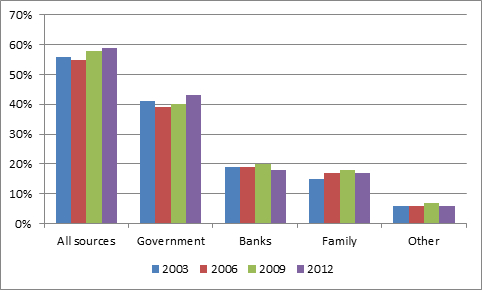
Anyways, here’s what the CUSC data shows in terms of borrowing incidence:
Incidence of Borrowing, by Source, 2003-2012
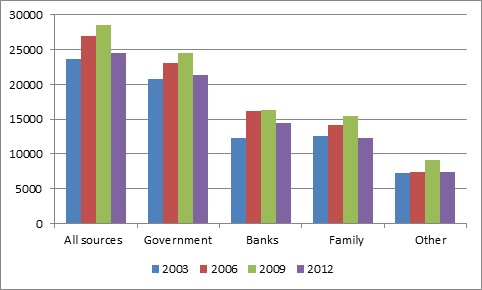
The small uptick in borrowing incidence is about what you’d expect. But where this data gets weird is when you look at the amount of total borrowing:
Mean Amounts of Borrowing (Among Those Borrowing), by Source, 2003-2012, in Real 2012 Dollars
Contrary to all expectations, overall debt fell by 14% in real dollars between 2009 and 2012. So, what’s going on here?
One possible answer concerns participation in CUSC, which changes slightly from year-to-year. Of the institutions who took part in the 2009 survey, twenty-six participated again in 2012; eight institutions left (notably Alberta, Calgary, UBC, and UVic), and ten came in (including York, Waterloo, Sherbrooke, and UQTR). Clearly, the addition of a couple of low-debt Quebec schools, and the absence of high-ish debt schools from British Columbia, is an obvious possible explanation for this mystery.
Except: in 2012, for the first time, CUSC weighted its response data by the size of each institution’s graduating class. Given the makeup of participating schools, this shift means that, in fact, 67% of weighted 2012 responses comes from high-debt jurisdictions (Saskatchewan, Ontario, New Brunswick, and Nova Scotia), compared to just 62% in 2009. Given what we know about regional differences in debt, from previous National Graduate Surveys, the new sample should, ceteris paribus, have actually delivered a slightly higher debt number. So the change in sample doesn’t seem to be the answer.
Other explanations? Well, total grants issues in Canada did increase, slightly, after the replacement of the Foundation with Canada Study Grants, and the class of 2012 would have benefitted from a few extra years of Canada Education Savings Grants, but neither seems likely to have changed borrowing patterns this much. It may also simply be greater prudence – students spending less in hard times.
Makes you wish we had better statistics, doesn’t it?


 Tweet this post

My initial reaction was the same as yours – that a shift in participation made the comparison a little dicey, but that doesn’t appear to be the case.
An alternative explanation (which could be examined somewhat using the CUSC individual-record data file) is that the cohort graduating in 2012, i.e., the first CUSC cohort to fully feel the effects of what Goldman Sachs et al. hath wrought, included an increased share of students assuming small or moderate loans, perhaps for only a portion of their studies. This explanation is consistent with what we see in both charts: a small but significant increase in the number of students who borrow coupled with a not-so-small but significant decrease in average debt.
I wonder if any of our friends in the federal or provincial student aid programs could weigh in on what they’ve noticed in their own jurisdictions.