

I’ve been doing some work on financial data of higher education institutions around the world, and specifically looking at what’s been going on at top research institutions compared to everyone else. And I thought maybe you all would be interested in what I’ve found for Canada.
For the purpose of this document, I have separated the six institutions in Canada which always come top in the Academic Ranking of World Universities (aka “Shanghai Rankings”) – that’s Toronto, UBC, McGill, McMaster, Alberta and Montreal – from the rest, which allows me to look at “the Big 6” against everyone else. Over the past fifteen years, those institutions have pretty consistently made up around 20% of the country’s total enrolments and about 30% of institutional expenditures.
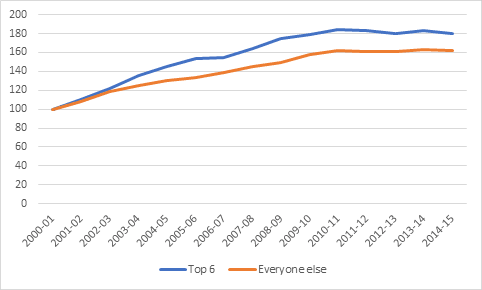
Figure 1 shows growth in expenditures in real dollars, with 2000-2001 as the base year. And basically what it shows you is that Canadian universities had a money-hose aimed at them in the early 2000s, with annual increases in the 9-10% range. These big increases continued for slightly longer at the big 6 than in the rest of the system, but by about 2006 they were growing at the same rate again (around 4% per year after inflation), and by 2011 growth had leveled off completely and was holding steady in real terms. The more dramatic and historically-challenged in the community call this “austerity”, but actually it’s just steady-state.
Figure 1: Change in Canadian University Expenditures, 2000-01 to 2014-15, indexed to 2000-01
But wait, you say, hasn’t participation rates been going up? Weren’t there a lot of new students to accommodate in there? There were indeed. See figure 2.
Figure 2: Change in Canadian University Enrolments, 2000-01 to 2014-15, indexed to 2000-01
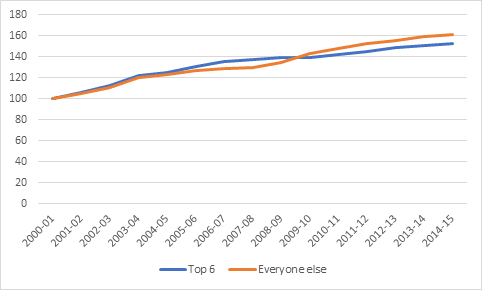
Two things about changes in enrolments: first, they increase at roughly the same pace in the top 6 as everywhere else, and second, they increased pretty consistently across the time period, rather than jump radically at first and then tail off, as expenditures did.
From the foregoing you can probably do the math in your head and work out what per-student expenditures look like: rising a bit in the 00s and falling a bit since about 2000. And this is in fact exactly what we see:
Figure 3: Per-student Expenditures at Canadian Universities, 2000-01 to 2014-15
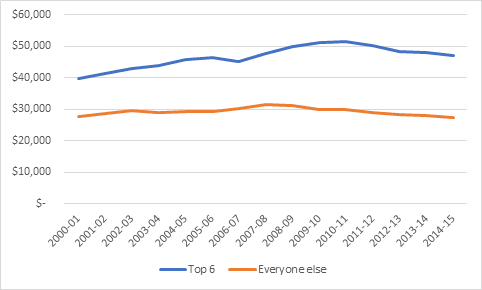
But there’s a bit of a difference here. If you’re not at one of the big six, per student expenditures in real dollar have been falling ever so slightly for seven or eight years and now sit right about where they were fifteen years ago. If you’re at one of the big six, they’ve been falling only since the turn of the decade and they currently sit about 20% above where they were at the turn of the millennium. The big institutions, which already spent a lot more per student because they had more expensive programs, did more research, etc, in a sense “pulled away” from the rest of the pack over the course of the aughts.
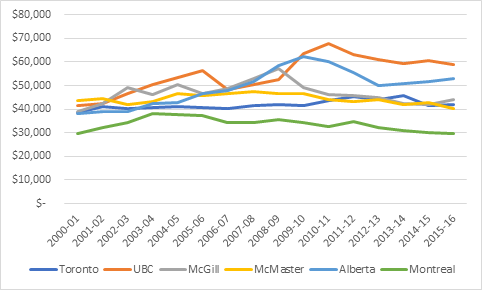
But actually what was most interesting to me in this exercise was looking at how heterogenous the “top 6” actually are in terms of expenditures. At one end, you have Montreal, which sneaks into the world top 200 with expenditures of only about $30,000 per student (Montreal includes both Polytechnique and HEC for these purposes), which in fact make them look – financially anyway – more like the “everyone else” category than the rest of the big 6. Toronto, McGill, and McMaster all spend just north of $40,000 per student. But the big western universities – Alberta and UBC – spend substantially more: over $50,000 in the case of the former and nearly $60,000 in the case of the latter.
Figure 4: Per-student Expenditures at Canadian “Top 6” institutions, 2000-01 to 2015-16
These graphs pose many interesting questions, but here are the three posers I’d most like to see explained:
i) why didn’t Canadian universities derive any economies of scale when enrolments increased?
ii) what are University of Alberta and UBC buying with their extra $10,000 per student per year?
iii) what does Montreal do that allows it to get into the upper reaches of global research universities with a comparatively pedestrian budget?
Tomorrow, we can look a bit at how some of Canada’s “close competitors” stack up.
 Tweet this post

On i): Once the first section of a class is full, and you are simply adding sections of the same class (replication), economies of scale (in the normal sense) seem to me to end. The only advantage of getting bigger is that you can offer a wider selection of different courses. And that may be (fully or partly) offset by diseconomies of scale from trying to manage a larger organisation (plus students feeling lost in an impersonal university).
Maybe one thing missing in the above is lumpiness. A small university, that normally offers 2 sections of a course, can choose between 1,2, and 3 sections. If it offers 1 section the class size doubles. If it offers 3 sections the class size drops 33%. A large university, 10 times as big, normally offers 20 sections, but can choose between 19, 20, and 21 sections, with only a 5% change in class size by adding or dropping a section. Being large lets you fine-tune.